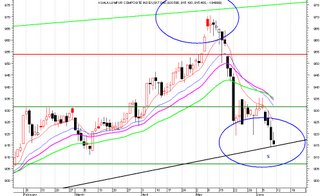
KLCI as at 9-6-2006 - Bullish Change in Trend?
The recent correction in the KLCI was predictable as it had reached the top of the long term trendline of tops from March 2004 to May 2006. Chart 1 below shows the 4 tops from A to D. At 'D' the correction was additionally confirmed with a weekly hanging man candlestick. Now the index has reached the bottom of the trendline which stretches from July 2003 to June 2006 and which was formed with 6 bottoms in the markets (Chart 2). This is a very strong support for the CI. Also there is an 'inverted hammer' pattern formed on Friday suggesting a bullish change in trend. If the market opens above 915.5 on Monday, then the bullish change is confirmed. This suggests that this is the bottom of the market in this correction & the bull should resume its uptrend. However, external markets especially the Dow may dictate the KLCI trend, so that is the only catch to this TA analysis.


0 Comments:
Post a Comment
<< Home