Update KLCI, Tebrau, RHB, Utama
1) KLCI - While movement has been positive since coming off the 900 low on Monday, volume has not been great, Daily MACD & RSI are still trending down (despite index moving up, thus a divergence, which is not a good sign). The 10, 21, 30 & 50-day Moving Averages still not in uptrend yet (X), so we still cannot say the CI is positive. There is very strong resistance at the long term uptrend channel A-B. Index has to break strongly above 922 to move positively into this channel. While I don't want to appear too negative, I think this short term rise will be capped at this level & CI might trend down again but good support is at 900. I would hold off buying till indicators turn more positive.

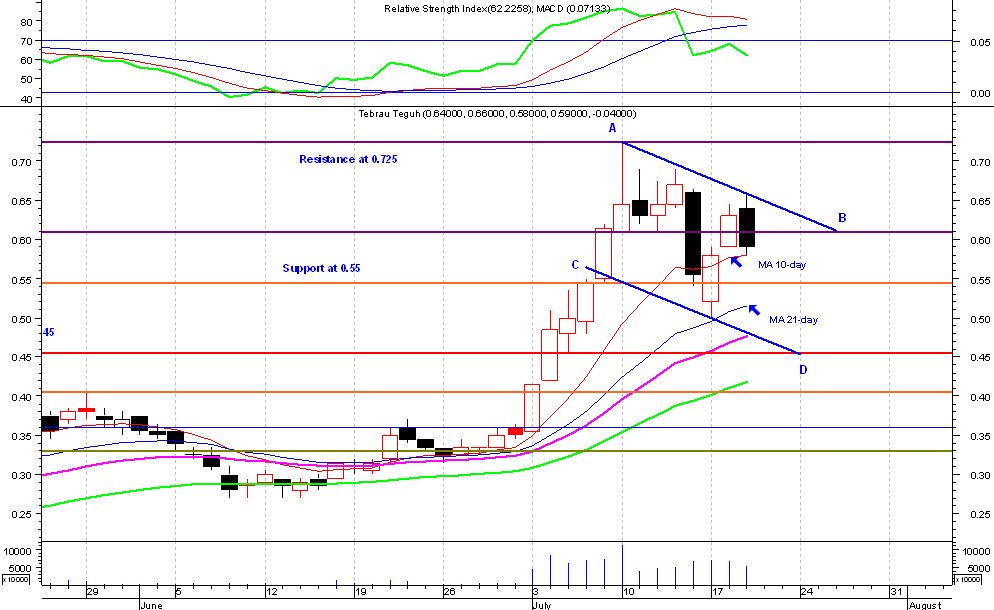
2) Tebrau - has formed a downtrend channel (A-B, C-D). It will only turn positive if it can break out of this channel with high volume (i.e. above 0.66). Until then the trend is down. Supports at 0.55 & 0.45. Break below 0.45 should be viewed very negatively though its unlikely to happen. RSI is down, Daily MACD trending down tho still positive. It is resting on the 10-day MA, but the 21-day MA should offer better support. Outlook is therefore for a short term downtrend from here.
3) RHB - Seems to be going nowhere. The trend is flat because volume is drying up. Support is at 1.16 & 1.05. Daily MACD negative & RSI is down. Chances are it will fall below 1.16 & find support at 1.05, but don't sell unless this happens. Don't buy either until a better signal is seen.

4) Utama - is trending flat to down. Though the candle looks like a bearish engulfing it is not. An engulfing candle only has real significance at a top or bottom to show a reversal. However the black candle coupled with Daily MACD & RSI trending down and the fact that it has slid below the flagpole top is not so good for Utama. If 1.07 holds & it goes above 1.08, then it is ok. But if not then look for support at 1.00. It is also right on the 10-day Moving Average, but this is not a strong support. The 21-day support at 1.00 is a better support. If it falls below 1.00 then it will turn very bearish with next support at 0.80 - 0.82.

posted by Dr. Siva @ 7:56 pm
![]()
![]()


0 Comments:
Post a Comment
<< Home