Plantation Theme - Sell or Hold?
Plantation Index- first black candle after 3 days of white candles. Can portray a reversal or maybe just a minor correction. We need another day to say for sure. However, individual stocks are showing possible reversals. Today is bottom-up trading, as different stocks within this industry may act differently. The smaller players may be in for a bigger correction as we can see below.
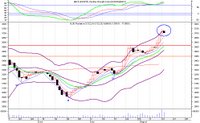
1) Asiatic - very strong reversal bec of the dark cloud cover (DCC) pattern on Tues. A DCC at a strong resistance (3.92) & when it pierces below the half way point of the prior long white candle is a strong signal of a reversal. SELL. Support at 3.58.
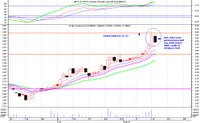
2) IJM Plantation - candlesticks indicate a reversal of the uptrend. On Monday we had a shooting star & Tuesday a hanging man, both are signs of weakness & when they appear at a peak it indicates a reversal of the prior trend. Strong possibility of a downward correction with strong support at 1.62. Traders should sell & pick it up after the correction.
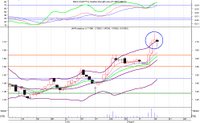
3) Kretam- has formed a spinning top & possible evening star at a peak. If prices do not open & go beyond 0.65 & if it falls below this then a correction is confirmed. Support is at 0.62, 0.585 & then 0.52. If it cannot stay above 0.65, then traders should sell & buy back later.
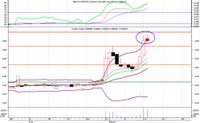
4) Kulim - has formed a large bearish engulfing pattern at the peak of a rally. Though volume is low, such a formation portends a change in trend & a correction is more than likely. Support is at 4.24 & 4.12 (Bollinger band support). Traders should sell Kulim & buy back later.

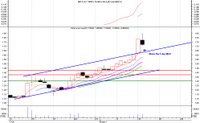
5) Rimbunan Sawit - finally a correction after a big jump on Friday. This is to be expected as it has also risen above the uptrend channel. Technically it looks like a Harami so we can say that is negative. But as other smaller stocks show reversals, RS would not go against trend. If prices do not stay above 1.72 then SELL & buy back later.

0 Comments:
Post a Comment
<< Home