Bearish KLCI & CI Futures
So the prediction that I have been making for the last week or so about an impending reversal in the CI & Futures has finally come to pass. In fact on Monday I said very clearly that we may see a major correction in both the CI & Futures on Tuesday & here it is. Everything I said about this situation has been based almost purely on TA. We even saw the Rising Wedge & I even quoted what Edwards & Magee said about the RW & its reversal potential. TA has clearly shown its strength, how can anyone even doubt the validity of TA now?
KLCI - saw a major top reversal at a strong resistance with the appearance of a dark cloud cover pattern (a large black candle that closes more than 50% into the prior day's large white candle). When this black candle appears after a large white candle esp at a resistance line this shows the bulls could not take take control of the market & have given up. The next move should also be down. When this is coupled with the rising wedge, if prices close below 959 (the Z-Y line of the RW) then it will be a major breakdown. Expect the fall to be fast & furious. Futures is at a discount of 14 pts to the CI so there is still some catching up for the CI to do (to the downside). Initial support is at 953 (weak) & 940. Strong support is at 921 & 900. Again I would not like to predict where the correction will stop, for that I will watch the candlesticks for a bottom reversal. But for now wise traders would STAY OUT of the market.

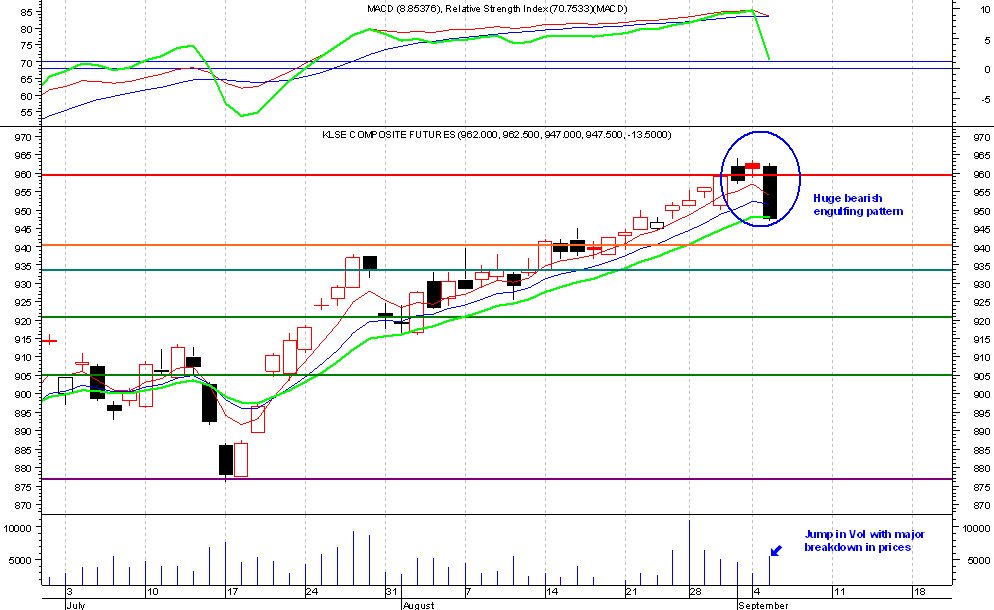
CI Futures - FKLI - also saw a major reversal today (Tuesday). It was the biggest drop for 3 months & is now trending 16 points below the CI, perhaps an ominous sign that the CI is due for a bigger correction in the next few days. It has formed a bearish engulfing pattern (large black candlestick, almost "engulfing" the prior day's candle) on higher volume, so it is clearly bearish. The weekly is also showing a major bearish engulfing pattern. Although we should ideally wait for a complete week to call the pattern for the weekly candle, I have no doubt that it will be bearish for this week. Supports are at 940, 933 & stronger support at 921. Below that we have support at 905 & 876 which will be very strong. We cannot predict where the correction will stop, we just have to watch the candlesticks for the downside reversal. The only way to trade the futures is to short it until we see a reversal.
posted by Dr. Siva @ 7:54 am
![]()
![]()


0 Comments:
Post a Comment
<< Home