Dangerous Times for KLCI
I thought that headline would capture your interest .... 8))
But I am not kidding...read on.
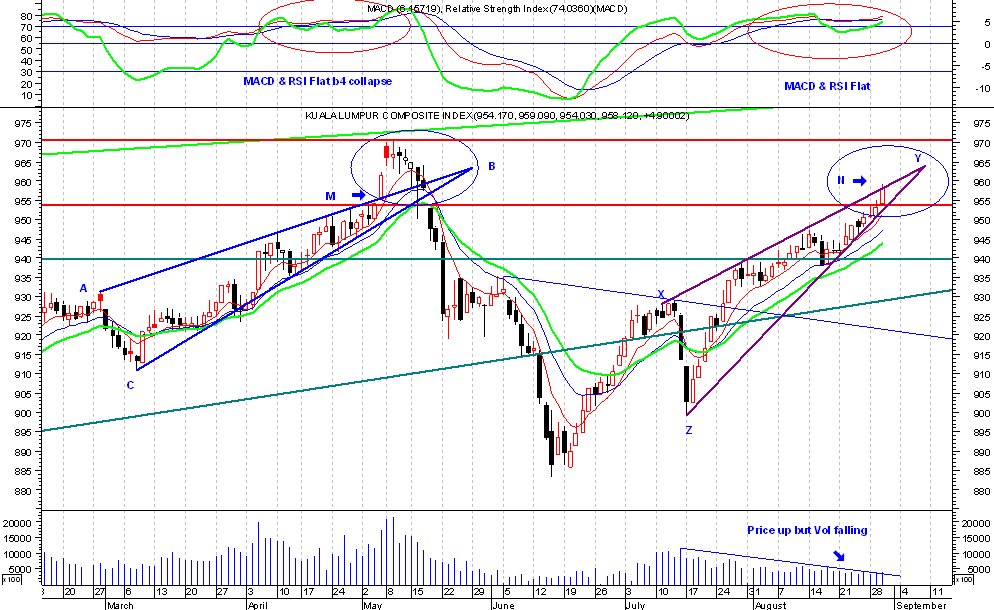
KLCI - Is history going to repeat itself? I see a rising wedge (RW) pattern in the CI (X-Y-Z) that is almost a mirror image of the Wedge (A-B-C) that preceded the last major correction in May/June this year from a peak of 970 to a low of 883, an 83 point drop. A breakdown from a RW is bad news & almost always leads to a major correction.
This is what Edwards & Magee say about it. "A RW typifies a situation which is growing progressively weaker in the technical sense. Prices ...fluctuate within the Wedge's confines for at least 2/3 of the distance from the base to the apex, in many cases they rise clear to the apex & in some actually go a short distance beyond pushing on out at the top in a last-gasp rally before collapsing. Once prices break out of the Wedge downside, they usually waste little time before declining in earnest. The ensuing drop ordinarily retraces all of the ground gained within the Wedge itself & sometimes more".
What E&M say is that a RW indicates the potential of a price collapse & the drop will be fast & furious & it will lose all the gains made within the Wedge.
Thats what happened in May/June. It rose from 910 to 953 (just like now), then had a last-gasp rally (M) from 953 to 970 including a gap up of 7 pts & then it collapsed & dropped 50 points in 2 weeks. Then it fell further to 883 beyond the base of the Wedge (C) of 910.
There are 2 scenarios today:
a) Prices may rally beyond 958 to 970 (only 12 points) just like May/June & then collapse first to 940/930 then later on to 900 or worse 883.
b) Prices may not rise any further today but collapse nevertheless to 900 or 883.
We have been seeing market weakness for the last 2 weeks. While the index has been rising, on many days we have more losers than winners. Also Vol has been falling despite index rising, a very uncomfortable divergence. Also while index is rising, RSI & MACD have remained flat. Finally 970 is a very strong resistance & has stopped the index on numerous occassions in the past.
Taking it all together the overwhelming conclusion is that the RW will come true. We may see a small burst in activity & then I predict a fall to 900 or 883 (unless 930 holds it up - possible but unlikely).
If you follow Dow Theory then the only call to make is to sell asap & get out of the market until the RW formation clears itself. Time for me to take that long holiday I have been promising myself. Good luck everyone.
posted by Dr. Siva @ 6:48 am
![]()
![]()


0 Comments:
Post a Comment
<< Home