Update KLCI & Futures
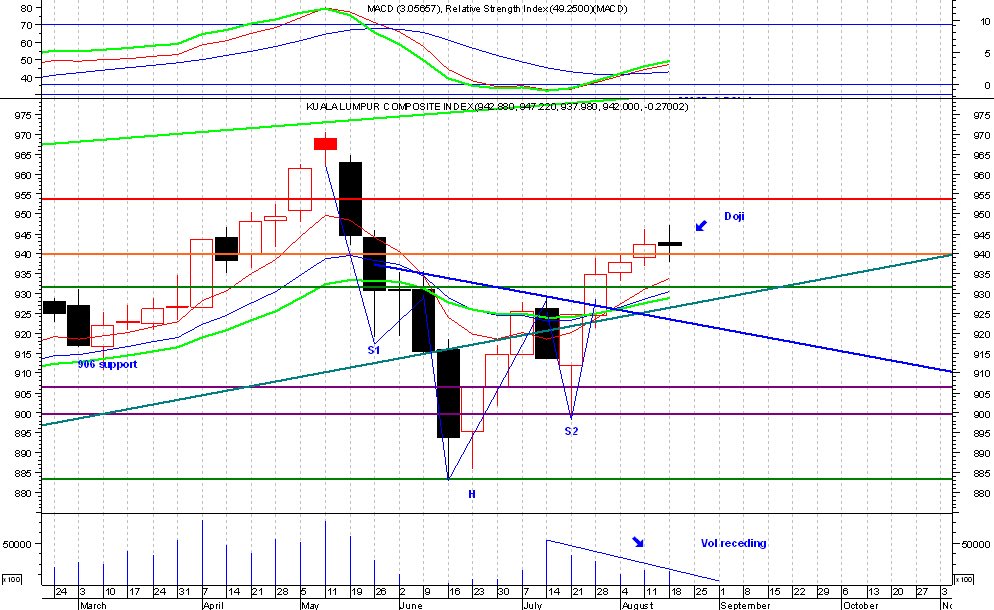
KLCI - is showing more signs of weakness. A Doji formed on Friday & its still just above the 940 support/resistance line & almost equal to the futures which is at 942.5. Daily MACD & RSI are trending down tho the weekly are still positive. The more interesting chart is the weekly chart (shown below) which is showing a Doji for the week. That is a stronger indicator of a possible correction, as candle reversals signs on a weekly must not be ignored. If Monday opens below 942 & closes below it, then it is a better indication that we will see the correction we have been expecting. BUT if Monday opens up & stays up then the Doji is invalid. So we have to wait for the market to give us its cue.
CI Futures is a diffcult call. It made a bullish strong white candle Friday & is still barely above the 940 support/resistance level, but volume is getting smaller. Daily MACD & RSI are flat. It is still above the 5,10 & 15 day MAV. Weekly it made a strong white candle which is bullish. Weekly MACD & RSI are still positive. Its one of those times when its almost impossible to make a call. So best I can say is that we have to wait for another 2 days to see what happens. I would not short or go long at this stage, just be patient & wait for iys next move.

posted by Dr. Siva @ 10:38 pm
![]()
![]()


0 Comments:
Post a Comment
<< Home