SJER Theme Review - Mulpha, Tebrau, UEM World
As requested by Goldman, perhaps its time for a review of the SJER theme.
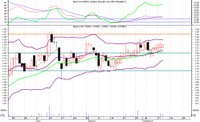
1) Mulpha - is quite resilient. Despite overall market falls it has managed to remain within the upper BB channel & also above the 10 & 30-day MAV & 1.20 support line. Daily MACD & RSI are positive altho the weekly are negative & falling. As long as it stays in the upper BB channel its fine & a breakout above 1.27 will be very bullish but that may take a few attempts first as it is a very strong resistance. You can buy & hold this with a cut loss below 1.19.

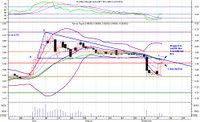
2) Tebrau - is this a one day wonder? Nice long white candle on Tues & then a long leg Doji today. If tomorrow prices open below 0.455 & stay below then it is confirmed -ve & it should fall back. Daily RSI turned +ve Tues but MACD still has not made a golden cross. Weekly MACD & RSI still -ve.
Also today prices were stopped righ at the mid BB line. It couldn't cross this & the BB is still falling. I view this as -ve. It must also cross above the downtrend line (A-C) currently at 0.49 which is also the point of the mid BB line. Double jeopardy, prices stopped by midBB & downtrend line so 0.49 is a strong resistance now for Tebrau. If it crosses above this tomorrow then it will be +ve if not then prices will continue their fall & its a one day wonder confirmed.

3) UEM World - is looking positive but with a caution because it is still within a Descending Triangle (A-B-C). A DT is generally a negative pattern but within this, UEMW has some positives. It hit the lower BB line & bounced up to cross above the mid-BB line. The BB also narrowed but with today's close is opening up again. If prices can stay in the upper BB channel it will be +ve. The other positive from this is that it bounced off the strong support line at 1.29 which was also the point from which it bounced off the BB. When this happens it is positive. Daily RSI is rising again & MACD just made a golden cross.
On the negatives it was stopped at the 1.50 resistance line so tomorrow's price action is crucial. Vol is also still low. Weekly RSI & MACD still -ve. Finally it is still below the downtrend line (B-C) which constitutes the DT & a strong resistance. It must break above this line on high Vol for it to turn bullish. Next 2 days will be interesting. Cut loss is at 1.29, a fall below this is very negative.


0 Comments:
Post a Comment
<< Home