Talking Stock With The Doc

This Blog has been created for the purpose of sharing my ideas on investing on Bursa Malaysia using Technical Analysis. Stock market investing is a science & TA a scientific tool used by investment professionals. TA also has its sceptics but this is an oportunity for you to follow TA based investing ideas. So welcome to my blog and may you "Live Long And Prosper".

Thursday, July 06, 2006

Watchlist: RHB Another Pennant Formation?


RHB has risen strongly from 2 to 22 June based on EPF's decision to substantially own RHB and its buyout proposal to Utama Banking group. It rose and formed a Flag formation bet 5 & 16 June which proved itself as a bullish formation when prices broke out strongly from the Flag on 19 June & rose quickly from 0.86 to 1.16 on 22 June.

It is now in correction mode & appears to have formed a Pennant another bullish formation. Volume has also fallen considerably confirming the pattern. Based on the Flag, the Pennant will be a continuation pattern so it indicates a continuation of the previous rising trend.

The target price is 1.43 based on the measurement of the "Flag pole" of the Pennant though it is possible that it may even rise to 1.52 which is its next resistance level.

Buy on high volume breakout between 1.14 & 1.16. However, a break below 1.08 will invalidate the Pennant formation.

Watchlist: Versatile - Bullish Pennant Formation?


Versatile Creative almost flew through the roof bet 19 & 28 June based on its shareholding in Iris Corp after Iris was removed from the designated stock list. It is now in correction mode & appears to have formed a bullish Pennant formation. Volume has also fallen considerably adding confirmation to the Pennant formation. A high volume breakout above 0.875 will be a very bullish indicator with a target price of 1.30 to 1.35.

The measurement for this TP is based on the bottom of the flagpole of the pennant @ 0.40 on 19 June and the high point on 28 June @0.88. The gain of 0.48 should be added to the point of breakout, which would be 0.875 giving a TP of 1.35.

Additionally this pennant is also in the form of an ascending triangle adding credance to the bullish stance. A breakdown below 0.845 however, would be very bearish, and the Pennant would not be valid.

One word of caution: as this is clearly a trading stock and possibly syndicated be very cautious and place trailing stops just in case.

CI Doji Star Correction


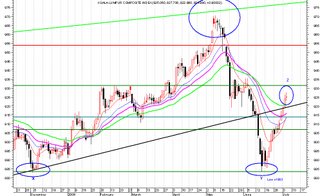
The CI has been rising almost daily for the last 3 weeks so a correction is due. The CI rose from the double bottom of 883 (points X & Y in the chart) to today's high of 927 (Z) representing a rise of almost 44 points (if you were Chinese that would be a bad number too).

The correction is now imminent with the formation of a Doji Star on 5 July. Expect a correction to 914 or even to 906, which would be very healthy for the market. It should then rebound and challenge the resistance at 931.

Monday, July 03, 2006

BUY: Tebrau Teguh Bullish Breakout


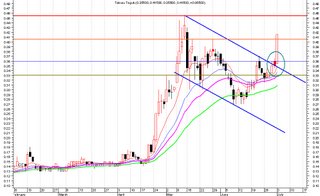
Tebrau made a strong bullish breakout from a falling channel which in some ways also resembles a flag pattern. A breakout from either is a bullish sign. Volume is high, prices remain above the 10, 21, 30 & 50-day moving averages, RSI is positive & rising with some way to go & daily MACD is positive. Hence technically Tebrau rates a strong buy at current prices. The recent high is 0.455, but based on recent lows of 0.15 before this rise & a flag pattern breakout, the target price is 0.65 which gives a 50% return, though it has potential to go much higher especially if its landbank is revalued.

Recently Tebrau has been in the news because of the South Johor Development Plan. It has 1,012 acres of prime development land close to Johor Bahru & the Causeway. The book value of its land is just 13.40 per sq ft. However, land around the area has been sold at RM 110 psf, hence the valuation should be much higher.

A possible revaluation is as follows: Land of 1,012 acres = 44,022,000 sq ft x RM110 psf = RM4,842,420,000 (thats RM 4.8 bil). If we take just 50% of value, thats RM2.4 bil. Divided by 670 mil Tebrau shares = NTA RM 3.58 per share.

Even if this may be the long term value of the land, it would appear that Tebrau shares are undervalued. If thats the case it has far more upside than downside and is quite cheap at 41 sen.

It is virtually debt free and is 42% owned by Kumpulan Prasarana & Rakyat Johor (Johor state govt.)

Fundamentally and technically it rates a strong buy.

BUY: ILB Bullish Breakout


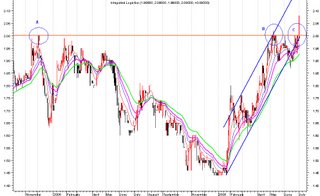
ILB has made a bullish breakout from its long term resistance at RM 2.00. This resistance extends for more than a year & it took 10 attempts before it broke out today (See first chart points A, B & C). Volume is not very high because the breakout happened after 4 pm. It closed at the high of 2.08.

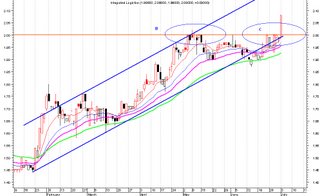
It has also formed a nice rising channel from late January (See second chart) & breakout happened at the lower channel line & right on the resistance level. Prices are above the 10, 21, 30 & 50-day moving averages. RSI & MACD are positive.

Resistances are at 2.20 & 2.40 (weak) and strong resistance at 3.00.

Target price for ILB is 2.95 (just below the strong resistance) giving a 41% return.

ILB is a very well managed company and its logistic business is growing very fast in China. So fundamentally its prices will be well supported.

The warrants are currently trading at an 8% discount to the mother share at 0.86 but it is thinly traded & expires on 9 March 2007 (249 days only). The exercise price is 1.05. Buy the warrant for potential 100% plus gains as the target price is 1.90 (assuming almost zero discount/premium to the mother share).

Cutloss is 2.00 for the mother share and 0.80 for the warrant.