Talking Stock With The Doc

This Blog has been created for the purpose of sharing my ideas on investing on Bursa Malaysia using Technical Analysis. Stock market investing is a science & TA a scientific tool used by investment professionals. TA also has its sceptics but this is an oportunity for you to follow TA based investing ideas. So welcome to my blog and may you "Live Long And Prosper".

Thursday, August 03, 2006

Update: Kulim, Dialog, Mulpha, UEM World

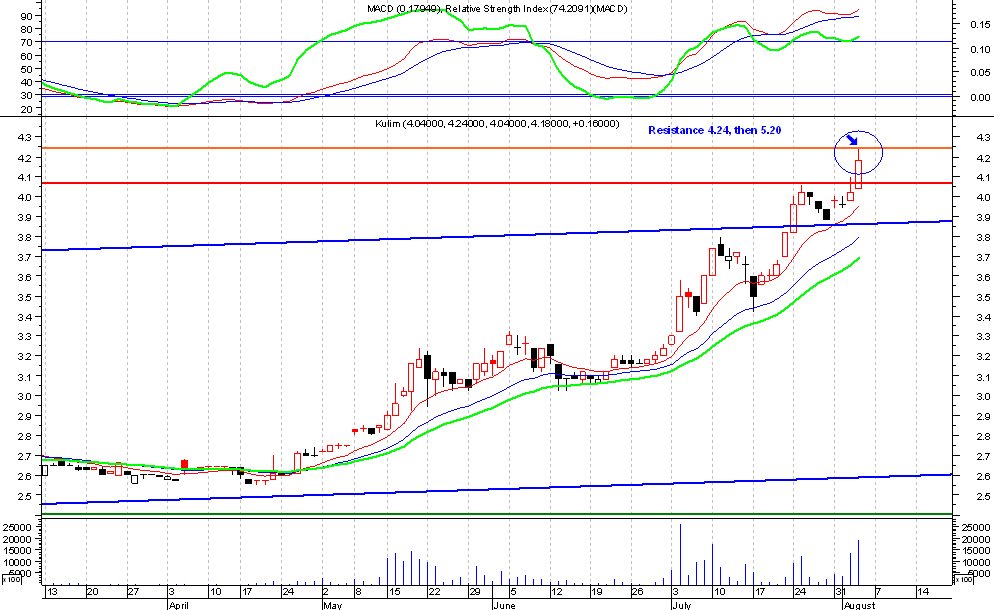
1) Kulim - has reached a 9-year high at 4.18 supported by rising CPO prices and its high NTA of 10.50. However 4.24 is a fairly strong resistance & stopped its rise on Thurs. RSI is still rising & at 74 is not overbought so there is further upside. Prices are also still quite close to the 10-day MAV line, so there is no massive divergence that may indicate a correction. Candlesticks also do not show a sell signal. Further upside is still possible with next strong resistance at 5.20. FYI, I called a buy on this stock on 21 July together with IJM Plant & Rimbunan Sawit. I still think there is much upside for plantation stocks.


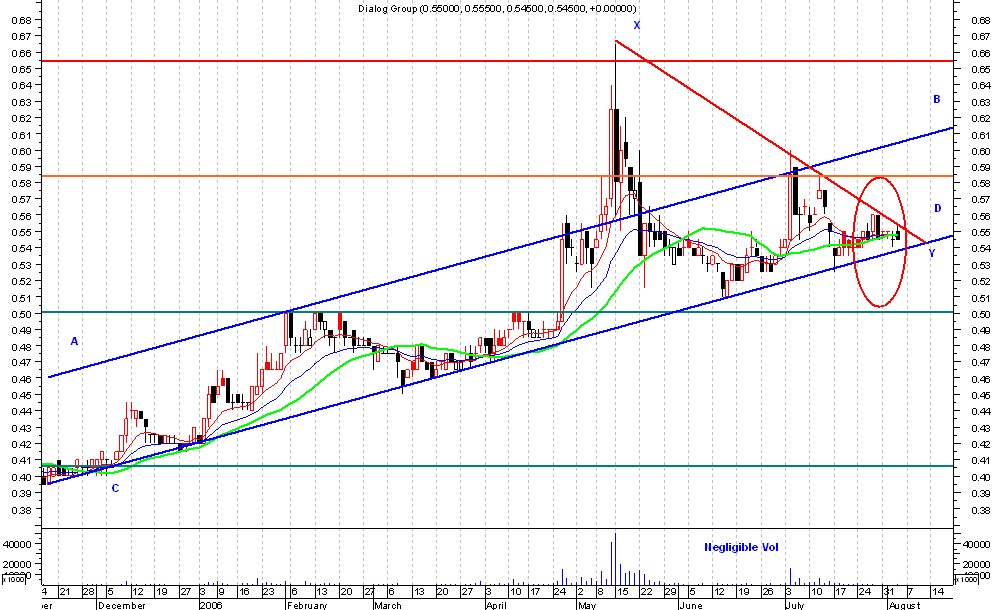
2) Dialog - Its at a crucial point at the base of the long term uptrend channel (blue lines) and also the downtrend line from the peak of 15 May. A fall below the lower channel line at 0.53 will be negative but quite unlikely as this channel has been holding it up since Nov 2005. Volume has been negligible, so a high Volume breakout above 0.56 will be a very positive sign. Support is at 0.50 & resistance at 0.58. If you think the channel will provide support, then this is a trading buy now with immediate upside of 0.60-0.61. A stronger breakout can take it to 0.66.


3) Mulpha - Is at a crucial point staying just above the midterm trendline. A fall below the line is negative but support is at 1.13. Volume lately has been very low, so there are no weak holders & strong holders may have accumulated the shares & are holding on. A Volume breakout above 1.27 will be very bullish. Next resistance is 1.50 then 2.12 & 2.90. MACD & RSI are flat but prices are holding above the 10,21 & 30-day MAV so its still positive. Fundamentally because of its landbank & projects in SJER, I doubt it will see any prolonged fall. A fall to 1.13 will be a buying opportunity. Nothing to do next except wait for its next move.


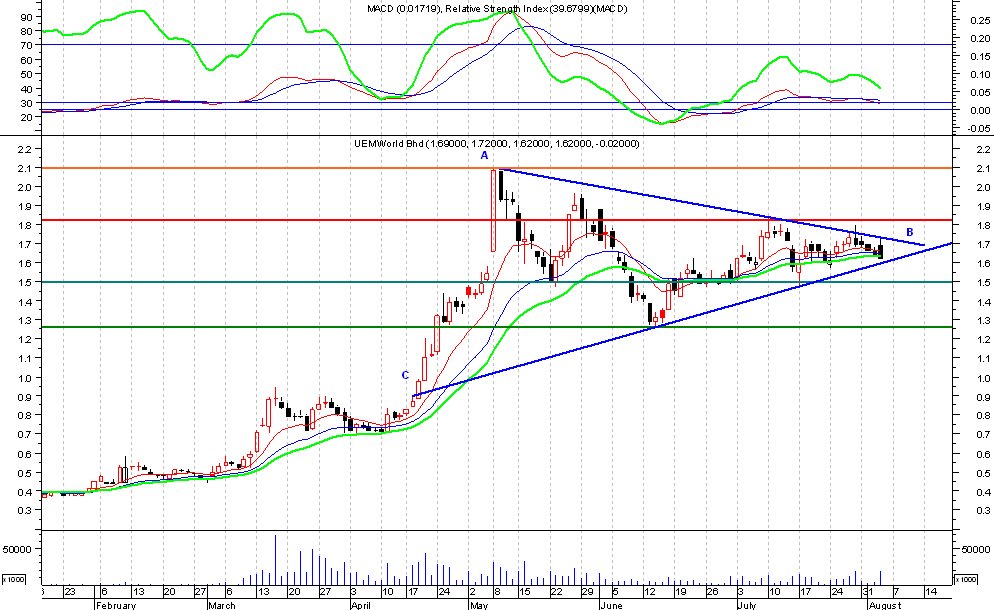
4)UEM World - despite the award of the 2nd Penang Bridge UEMW actually fell today. The dreaded M'sian "Buy on rumour, Sell on news" curse strikes again. Technically it is at a crucial point in the long symmetrical triangle. A break below 1.60 will be negative with support at 1.50 & stronger support at 1.26. Strong resistance is at 1.72, but a break above 1.72 on strong volume will be very bullish with resistance at 1.82 & strong resistance at 2.10. RSI & MACD are almost flat with a slight downward bias. Nothing you can do here until we see its next move. If you own the stock SELL if the fall below 1.60 is accompanied by high volume BUT this is quite unlikely because the fundamentals are good. A low volume fall below 1.60 will not be too bad with the supports likely to hold at 1.50.

MTD Infra - Buy When Nobody Wants to Buy?

MTD Infra is our discussion stock today on the "Buy When Nobody Wants to Buy" strategy. You can read about this strategy under the "Trading Strategies" section on the right.

When a stock has fallen considerably & all short term sellers have been shaken out of the stock, then it may present a buying opportunity because downside will be limited & unside potential greater. MTDI is displaying this characteristic. It fell from the Double Top high of 1.50 to a low of 0.98 and is now hovering at 1.00. Volume has fallen considerably from a high of 43 mil shares at the peak to just 1.68 mil today, a fall of 96% in trading volume. In fact volume has been steadily falling from the peak & today is almost the lowest.


This indicates that all the weak holders are out. The last time it fell from the first peak of 1.50, it fell to a low of 0.94, then began its steep ascent to the second double top of 1.50. Based on this 0.94 will provide a very strong support. The current level of 1.00 is also a strong support. RSI & MACD are also flattening, showing that selling is getting weak.

The weekly chart is more interesting. The last time it rose after big falls was when we had a spnning top followed by a bullish engulfing pattern (A) and next it was a hammer & bullish engulfing (B). Today we do not yet see any positive candlestick pattern. When we do, it will signal the start of the upside.


Advise- Users of this strategy should WAIT until weekly candlesticks give the buying signal. It might take a 2-3 weeks but when it happens, start picking up shares from that point. The upside resistances are 1.05, 1.10 & 1.20. The potential to rise to 1.50 is there but that would be optimistic. However gains of up to 20% are possible.

So the suggestion is to be patient just for a while longer.

Wednesday, August 02, 2006

Update: KLCI, CI Futures & Plantation Index

1) KLCI is trending flat. Not much action & no major signals. Support remains at 931 & a breakdown below this will find support at the IHS neckline at 926. I expect the neckline to hold. Fundamentally, external forces may have an impact on the CI. Higher oil prices are a worry though the Dow & world markets seem to be holding steady so far. I will be more concerned when we head into September when the hurricane season starts in the US. If there is a bad one & some refineries are shut down we may really see a big spike in oil prices.


2) CI Futures - August futures started slowly Monday but rose strongly with a bullish engulfing pattern today. On this basis we will see it narrowing the band with the KLCI soon. Futures are bullish at this point with initial resistance at 921 & then 940.


3) Plantation Index is getting weaker. Prices are falling but volume is getting higher. This diversity is a concern. As mentioned earlier I expect the index to fall slightly and possibly hit the IHS neckline support at 3360. The only possibility of negating this is if the strong support at 3443 holds, then the index may bounce back up again. However, despite rising CPO prices, the general opinion is that plantation counters have risen beyond CPO fundamentals & a slight correction will be healthy. Due to fundamental demand for CPO this correction will not be severe & the index & plantation Co share prices should continue their uptrend again soon.

Tuesday, August 01, 2006

KLCI, Futures & Plantations- Pullback to Neckline?

1) KLCI - In an Inverted Head & Shoulders formation, it is common for prices (or the index in this case) to pull back to the neckline to correct the overbought condition before prices then march on to the measurement target (976/980). In our case will we see a pullback to 926 (the neckline of the IHS) soon? Well prices have been moving up for almost 10 days (with only 2 minor corrections) from a low of 900 to a high of 938. Though this is not a huge amount, the rise is getting smaller & weaker. On the whole I believe we'll see a correction soon with a target of 926. A breach of the neckline would not be good so lets hope it stays above 926.

2) Futures - Also the futures have risen even faster & stronger than the CI and it is definitely due for a correction.

3) Plantations - the same is happening here. We may also see a pullback to 3360 though in this case the support at 3443 is quite strong. If there is a pullback then 3360 is the target & then a rise to 3639. A pullback is very healthy though because prices have risen too fast in the plantation stocks.

Comments: Tebrau, Plantation stocks, Kretam, MVest

My Data provider is down today so I have not received today's KLSE stock data & so cannot provide charts. However, my comments are:

1) Tebrau - The expected upside due to the SJER announcement by the PM didn't materialise, no doubt a case of buy on rumour, sell on news. However, technically there was no significant change. Support is still at 0.55. Minor resistance has formed at 0.63 - 0.635. Should traders sell above 0.55 or wait? Technically there is nothing to indicate we should sell, there are major no sell signals. Trading is still flat if anything. Volume was surprisingly low. So following TA, its a case of no signals either way, no Sell no Buy.

2) Plantation Stocks continue to see lots of interest. Kulim rose strongly & so did Kretam no doubt due to the Star write-up on underperforming plantation stocks. Kretam has resistance at 0.62 & 0.70. MVest also rose on higher volume. MVest resistance is at 0.50 & 0.565. Should you jump into these shares? Kretam does inhibit better signals with the MACD & RSI positive & the 10,21 & 30 day MAV all positive, even before Monday's rise. But Tuesday may see some mild correction due to the huge rise.

Unfortunately I do not know much about the fundamentals of these stocks. If fundamentals are sound, then perhaps its worth a risk with a tight cutloss BUT I would not be jumping into stocks on the basis of possibilities. And I am not advocating anyone doing this either.

Sunday, July 30, 2006

Market Play 2 - Plantations - Kulim, IJM Plant & Rimbunan Sawit

Our second market play is the Plantation theme. CPO prices have risen to a record high above RM 1,600 a tonne & the Plantations Index is at a 12 year high. CPO will continue rising as it is still at a discount to soya & rapeseed oils. The Biodiesel theme & future purchases by Biodiesel factories will underpin CPO prices, so plantation stocks will be making extraordinary profits for 2006 & 2007. Major stocks like IOI & KLK have risen strongly for a year & will continue to rise. I have selected 3 stocks to review Kulim, IJM Plantations & Rimbunan Sawit (a newly listed stock associated to the Rimbunan Hijau Group).

1) Plantations Index - I have written about this before. It has formed an IHS & is now on a low volume correction with support at 3443. It has also formed a Harami candlestick pattern so it may start rising again Monday. The upside target is 3639. RSI & MACD are positive & it is above the MAV. Next moves will be up unless it decides to test the 3443 support first but then its up, up, up all the way.


2) Kulim - Has been rising in an uptrend channel since 2002 & rose very strongly from 2.60 to 4.06 in last 3 months. It is now above the channel but on a low volume mild correction. Daily & Weekly MACD are positive, but daily RSI has turned down slightly. Weekly candlesticks have formed a potential shooting star but an open above 3.86 & close above 3.88 on Monday will negate the weekly s-star. It is also above the MAV & strong support is at 3.84. After the mild correction it should rise again but a break below 3.70 (the 21-day MAV) will be negative. A strong break above the recent high of 4.06 will take it to 4.24 & possible mid term target of 5.20.

3) IJM Plantations - Rose strongly to 1.62 & is on a low volume & mild correction now. Has formed a good uptrend channel but rose above the channel on strong buying. Strong support at 1.55, RSI & MACD are positive, prices are above the 10,21 & 30 day MAV. A very good buy. Upside is not known as historical high is 1.62 so we have to watch the candlesticks.

4) Rimbunan Sawit - Has risen strongly since its debut on Bursa in June. It has formed a nice uptrend channel & is now in the middle of the channel. Support is at 1.30 & resistance at 1.42. A break below the channel at 1.27 will be very negative but this is highly unlikely. I expect prices to continue rising & to breach 1.42 anytime soon. This is a very good mid term buy (3-6 mths). Target price is uncertain as it is a new stock so we will have to keep an eye on the candlesticks for pointers.

Market Play 1 - SJER - Mulpha, Tebrau & UEM World

There are currently 2 themetic plays on Bursa M'sia, the South Johor Economic Region (SJER) & the Plantation sector. I will consider both plays & some selected counters for each. We start with SJER. This is about the multi billion Ringgit masterplan in the 9th Msia Plan to develop the Southern Johor Corridor, basically around Nusajaya which will be the location for the new State Government & also to take account of the 2 major Casino/Tourism projects in Singapore. The idea is to develop the corridor which consists of major tracks of under-utilised landbanks for housing, industry, government and theme parks to attract tourists from Singapore. As this will inevitably provide major construction works & also increase the value of the landbanks there it will benefit some of the major construction Cos. & landowners in SJER. The PM will make the announcement on development of SJER (headed by Khazanah) tomorrow (Sunday 30 July) & it should be the catalyst to move these counters up.

The three selected counters Tebrau, Mulpha & UEM World, are all major landowners & developers in SJER & have already been part of the "play" on SJER. Is there still room to move, technically? Lets see.

1) Tebrau - Positive break out of the symmetrical triangle on Thursday on better Vol, then had a mild correction Friday. Immediate support is at 0.61 & a pullback to the triangle has support at 0.55. A break below 0.50 is very negative. It is above the 10,21 & 30 day MA but daily MACD & RSI has not made positive moves yet. Hence there is no firm direction unless it has a positive move on Monday. The MA offer strong support at 0.55 also. A break above 0.725 will be very positive & will take it to 0.84 & 1.08. A positive announcement by PM may be the catalyst. So watch this counter for its next move. Aggressive traders can buy but place cutloss at 0.54. Others may wait for another day of positive move before buying.


2) Mulpha - Has been trading rather flat for the last 2 months. It is above a rising trendline, volume has been extremely low, Daily RSI & MACD are flat, but it is just sitting on the 10, 21 & 30-day MA, which is a good sign. Immediate resistance is bet. 1.21 & 1.27. A high volume break above 1.21 & 1.27 will be very positive & will take it to 1.50, then 190/2.00. Signs are good for a positive breakout but a breakdown below 1.14 will be negative. You can place a cut loss at 1.13.


3) UEM World - It has formed a very large symmetrical triangle with prices reaching the tip of the triangle. Something has to happen soon. If it breaks out of the triangle on the upside on high volume, then it is very positive & will have strong upside because the triangle took 3.5 months to form. An upside break on high volume must breach the immediate resistance at 1.82 then 2.10. If that happens then it will possibly reach 2.26 or if there is very strong interest then 3.00. However, a downside break can take it down to 1.50 (cutloss) or 1.26. Daily RSI & MACD are flat but prices are sitting just on the 10, 21 & 30 day MA (which is a very good sign). If the announcement by PM is positive, then expect a positive breakout for UEM World (which is controlled by Khazanah anyway).

KLCI & Futures - IHS confirmed

1) KLCI - The Inverted Head & Shoulders pattern has been confirmed with the CI staying above the 932 resistance & the 928 neckline of the pattern. While a pull back to the neckline in IHS pattern is common, it is not necessary. As the Dow Jones closed higher on Friday & there are no real negative sentiments, CI will likely stay above 932 & then rise to the Target of 976-980. Oil price has also fallen slightly. The only concern is the slowdown in US economy. Will this affect the world economy or is it good because now the Fed will not raise interest rates anymore? Generally it should be viewed positively as there is still growth.


2) CI Futures - Has finally corrected after 8 consecutive days of rises. Support is at 933 & 921. A pullback to 921 will be very healthy. Further support is at 905. Daily RSI & MACD are positive & index is above the 10,21 & 30 day MA, so all indicators are very good. Upside will resume after a mild correction probably to 921 max.