Talking Stock With The Doc

This Blog has been created for the purpose of sharing my ideas on investing on Bursa Malaysia using Technical Analysis. Stock market investing is a science & TA a scientific tool used by investment professionals. TA also has its sceptics but this is an oportunity for you to follow TA based investing ideas. So welcome to my blog and may you "Live Long And Prosper".

Saturday, August 12, 2006

Plantation Theme + Stocks

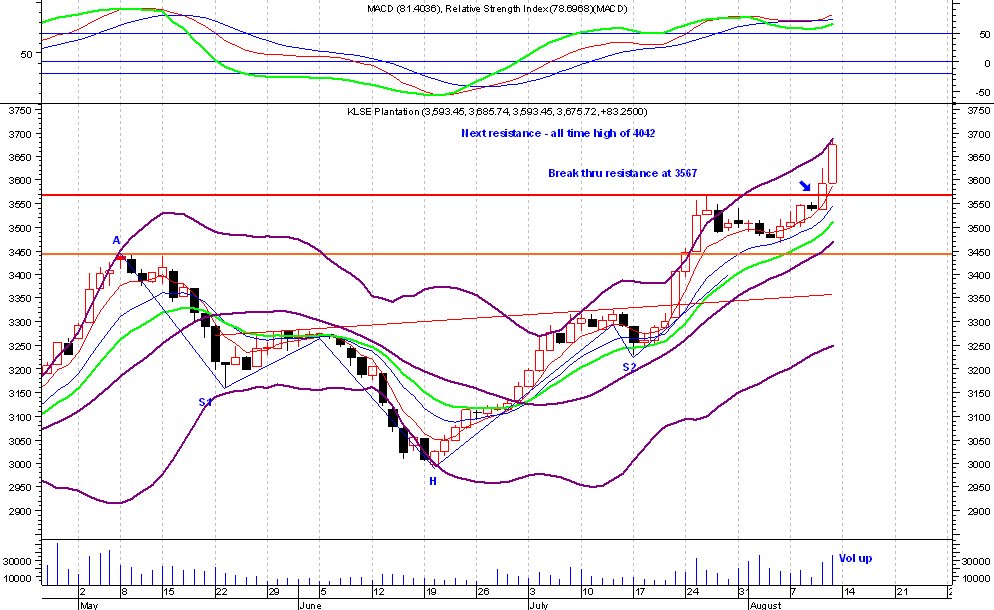
1) Plantation Index - Moving up very strongly. Broke thru resistance of 3567 very strongly with long white candles on high volume on Thursday & Friday. Also in the upper band of the Bollinger Band & above the 5,10,15 & 20-day MAV. Daily & weekly RSI & MACD are positive. It should continue rising with short corrections in between. One reader said that Hedge Funds are involved in pushing up CPO prices & this Index. That may be true but that does not mean we shud avoid this sector. We shud benefit from this but keep an eye on technicals & take small profits along the way. However fundamentals are there with lower peanut & soya yield in India & USA respectively, higher demand from India, China & from biodiesel usage & also lower stocks of palm oil in M'sia & Indonesia. Rising oil prices will also mean more interest in biodiesel & higher CPO. Just like oil prices, lower supplies & higher demand equals higher prices. This play may still have some legs to go. Enjoy the ride & if you had bought some of my early picks, you'd be up very well. Some stock analyses follow.


2) Asiatic - Broke out of its recent resistance at 3.58 very strongly on high volume. Daily & weekly RSI & MACD are positive, its also above the 5,10,15 & 20-day MAV. Looks good to hit its next target of 3.92 & beyond that is its all time high of 5.15, but that is a pretty high target, possible, but we have to watch the signals. But for now its should still continue rising.


3) IJM Plantations - One of my early recommendations. Superb stock & Friday it shot through its recent & historical high of 1.62 on very high volume. Its above the 5,10,15 & 20-day MAV, its just above the upper Bollinger Band (still ok) & MACD just made a golden cross. RSI is positive. Overall a very good stock & still a BUY.


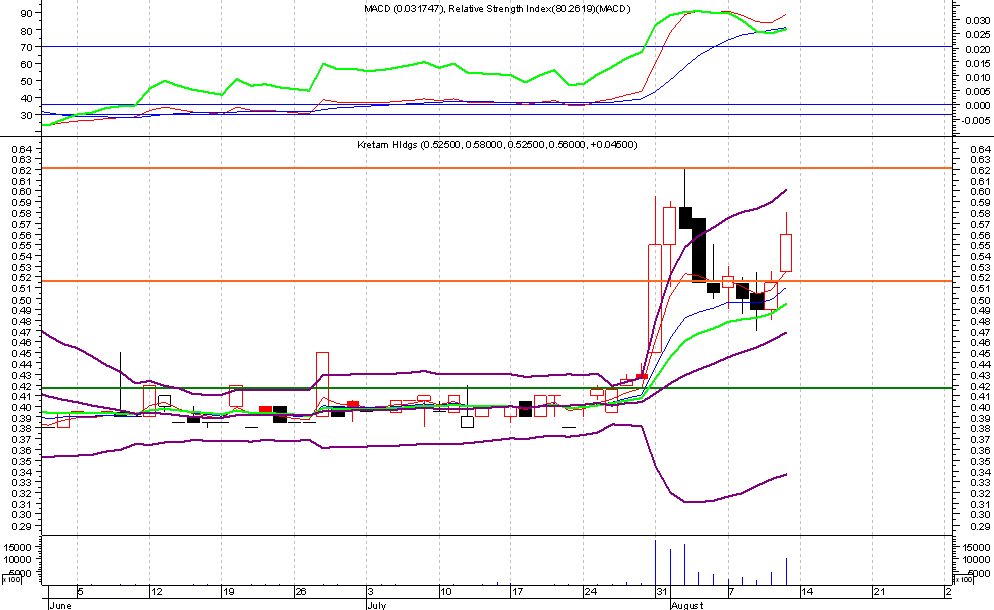
4) Kretam - I am reviewing for the first time. Just started its rise so its a laggard stock. The bollinger band has just started expanding & prices are within the upper band & rising. It has moved above the 5,10, 15 & 20 day MAV, RSI & MACD are positive & Volume is rising. The weekly signals are also positive. This laggard is showing signs of catching up with its bigger cousins. Initial resistance are at 0.62 & 0.70. Signals indicate a BUY.


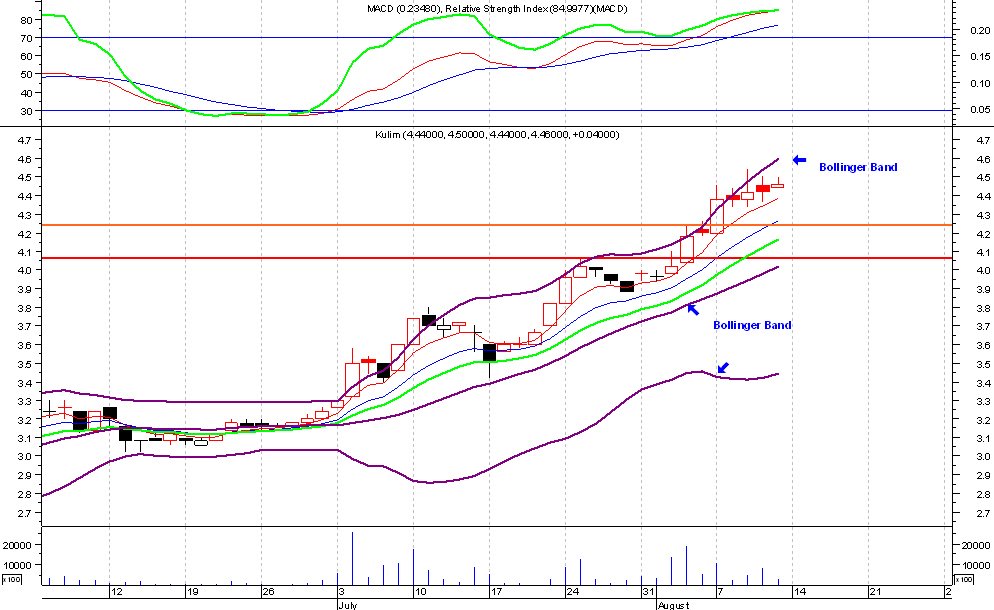
5) Kulim is another recommendation that has done well. It is above the 5,10,15 & 20-day MAV & is also riding along the top end of the Bollinger band. The rise has been punctuated by intermittent corrections which is healthy. Daily RSI & MACD are still positive & despite the rise are not overbought, although the weekly RSI is very overbought. Historical high is 5.20 & its 50:50 that it may just reach that high. Rising CPO prices may take it there. Bec of the swift rise I am keeping an eagle eye on the candlesticks looking for a correction & also if it falls below the 5 & 10-day MAV I will consider a top, but for now all signals still do not show a correction.


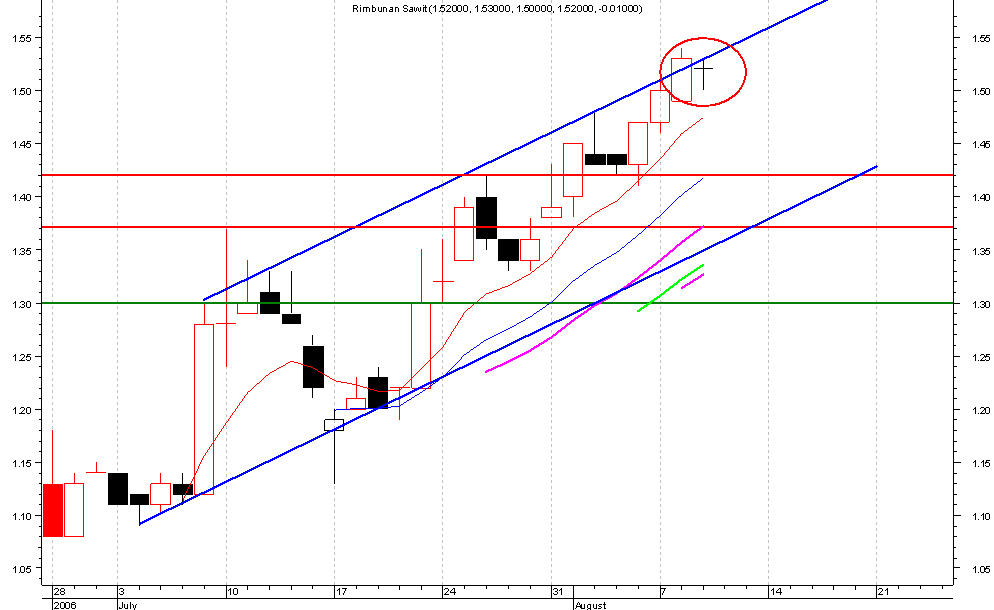
6) Rimbunan Sawit - Another one of my early recommendations has performed admirably. It is currently above the 5,10,15 & 20-day MAV & within the rising channel. As a recent listing, we don't have enough data to plot & seek many signals like MACD, RSI etc, so the use of several MAVs is suitable. I will continue to hold this until it falls below the 10-day MAV, only then will it trigger my sell call.

Friday, August 11, 2006

Update: Plantation, Asiatic, KLCI, Landmarks, Tebrau

1)Plantation Index has broken through the recent resistance of 3567 on higher volume. Looks like rising CPO prices and dwindling stocks will underpin the index. Look for further rises in most plantation stocks. IJM Plant, Rimbunan Sawit & Asiatic are good buys.


2)Asiatic broke through the recent high of 3.58 on high volume. Next target is 3.92.


3)KLCI is rising slowly but surely above 940. This is a good sign & Thursday also had higher volume. If it can stay above 940 on Friday then we have the 3-day rule, i.e. if prices can stay above a resistance line for 3 days then we can say that resistance has been surpassed positively. Next target is 950. Other signals are flat to positive. A break below 940 will be negative.


4)Landmarks - Has formed a long legged doji star at a peak. Possible indication of a change in trend & correction but this needs confirmation with an open & close on Friday below 1.80. If prices close above 1.80 then the doji is invalid. No other indicator is signalling a correction though, so traders must wait for additional signals after Friday.


5)Tebrau - Finally after 2 weeks of down days we have a bullish engulfing pattern. It still has to rise above 0.55 to be positive again but today was a good signal. The only negative is that volume is still down. Keep an eye on the resistance of 0.55 & support of 0.50. A break above resistance is positive & below support is negative. The descending triangle is still there & until prices break out of the triangle, Tebrau is still not bullish yet.

Thursday, August 10, 2006

Comments: CI, US econ, Kulim, RSawit, Tebrau

1) KLSE - It has breached the 940 resistance but not convincingly enough for me. While the trend seems to be rising, it has been rising on lower & lower volume. This divergence is very uncomfortable. Also the break of 940 was accompanied by the lowest volume in a month! Daily RSI & MACD are flat another weak sign. However the weekly MACD has just about made a golden cross (just). Hmmm many signs pointing to a downturn but prices are still rising & weekly MACD is turning positive. Read on!


2) US Economy & Bursa
Whoa there, whats happening to the US & oil prices? Well the Americans are sure worried about the economy, an early morning rally quickly fizzled out & the Dow ended up with a big loss. Latest news is that there is a BIG GLUT in new homes for sale & a major slowdown in real estate.
http://money.cnn.com/2006/08/09/news/companies/toll_brothers/index.htm
Oil prices are just shy of the record high & the hurricanes haven't started yet, but soon will & thats when oil prices will rise to US$ 80 & beyond.

Signs are slowly creeping in of a real slow down in the US economy. I think Asian markets will very soon react to this US slowdown and Bursa will also be affected. I expect to see the CI correcting today or tomorrow & a fall to 925 should be expected. A bigger fall should not happen but for that we have to wait for further signs. Anyone buying from this point on has to be very cautious. You have been warned!

3) Kulim - what a spectacular ride. Definitely one of the best performing plantation stocks this year. But weekly RSI is very overbought, prices are rising on lower volumes & maybe a correction is very much due. Rising CPO prices & analyst valuation at RM 10.00 are keeping interest in this stock going. But I think it has to slow down soon & it probably will UNLESS CPO prices continue to rise strongly (as suggested in today's NST, due to lower oilseed production in India for eg.) holders may start slowly selling down. The signals are getting weaker but there is no sell signal yet, thats why I didn't say sell now, but taking profits from this point will be a good strategy. The warrants are also overbought more than the mother stock. BUT do monitor CPO futures as further strong rise in CPO prices will keep prices of Kulim & other plantation stocks underpinned & they may continue to rise.


4) Rimbunan Sawit has formed a Doji Harami at the upper channel line. Does this mean a correction? Possibly because palm oil stocks have risen exponentially for quite a long time (in the case of the blue chips like KLK & IOI, for a year). However because of rising CPO prices maybe this correction will be mild. Nevertheless if RSawit opens down on Thursday, then it will probably be a correction with support at 1.42 & the lower channel line. Long term holders may just want to hang on for the ride but short term traders may want to take profit BUT wait for the correction to be confirmed with a lower open/close Thursday. However do note the point on CPO prices as stated above.


5) Tebrau has now had 9 down trading days, without a gain in sight. It sure takes patience to hold this stock. Yesterday it hit a low of 0.505, as close to the strong support of 0.50 as you can get. It has now formed a descending triangle & if it breaks 0.50, then its a very bad sign especially when you haven't had an up day in 2 weeks. I will sell if it goes below 0.50 (on closing). RSI & MACD are still going down. Next support is at 0.45. Looks like all the so called SJER stocks are down, incl UEM World & UEM Builders.

Wednesday, August 09, 2006

Comments: KLSE, MTD Infra, Tebrau

1) KLSE is still flat. Still needs to break above 940 to turn positive but any external weak factors will lead to a fall. Support is 931 & 926. I believe upside is limited & trend will be to the downside. No budget rally this year? Maybe if it falls to 926 then there will be one.

2) MTD Infra - is still holding above its support level of 1.00. Daily RSI & MACD are turning up. There is also a 2-year old trendline (A-B) which is holding up prices at this level. Technically it is still providing support & coupled with low volume this may be the low for MTDI. Reader Doraidd is sceptical of this stock & feels that stock holders like EPF may be selling on strength, but we can only base our judgement on TA not what holders may be doing. Doraidd has some valid points but I hold my view that technically there is support. Also fundamentally MTDI is not a rotten stock like Iris, because it has a fundamentally valid business and does have intrinsic value. That means it will have a support level & that may be just about right here at 1.00. However, like all speculative stocks you trade at your own risk but with tight cutloss levels I believe this stock is worth the risk with cutloss below 1.00.


3) Tebrau- In a slow downtrend. Formed a spinning top today below the first support line of 0.55, not very good. Strong support is at 0.50. If it breaks 0.50 then traders have to sell as it will weaken the chart considerably. It is still touch & go at the moment because it is forming a clear descending triangle & other indicators are all negative. The only consolation is the low volume, so maybe, just maybe it may bounce back. 0.50 is the key. See previous charts, not much change.

Sunday, August 06, 2006

Review: Old Favourites - PTower, SYF, Verstl & MTD Inf (BUY)

Lets review old favourites that reached unbelievable heights just to plunge fast & furious leaving a lot of losers. Based on the "Buy when no one wants to buy" strategy, we review 4 stocks, in case of new buy signals bec. many old fav will always make a return to be new fav again.

Strategy: For buy signal we use weekly charts & look for:

- Candlestick buy signal (Hammers, Bullish Engulfing, Doji, Morning Star etc)

- Minimal or negligible volumes - weak holders have sold out & selling on upturns will not be very strong

- Prices must have fallen close to previous bottoms & strong support levels

1) Polytower - The last fall from a peak of 1.53 to a low of 0.58 turned around with a piercing pattern in early June (A). It had also reached supports at 0.58. The turnaround was strong & it reached a high of 1.45 giving a return of 150% for followers of this strategy. However, current prices have NOT reached their lows yet (B). There is no candlestick buy signal although volume is reaching its lows. Also it is still about 0.10 above strong support levels. So PTwr still is in correction mode, no turnaround yet.


2) SYF - After reaching a high of 1.86, SYF fell fast to a low of 0.68. Then it turned around with a hammer/bullish engulfing pattern in mid June (A) & climbed to a high of 1.18 giving a 73% return. Vol reached negligible amounts & it had reached a support level at 0.68. However current prices while close to a support level & on low volume, does not show a candlestick buy signal yet (B). So the turnaround has not come yet, so we cannot buy in yet.


3) Versatile - The last fall reached a low of 0.38 then showed a hammer followed by a strong bullish engulfing pattern. Today vol is very low & it is close to the 0.38 support level but candlesticks still do not give a buy signal. So again we have to wait.


4) MTD Infra is interesting. On 2 separate occassions (A & B) after big falls, prices reversed & rose very strongly when a bullish engulfing candle appeared at the bottom signalling the turnaround. On both occassions it found support at 0.945. This time we saw a long legged spinning top last week & this week a Doji (C) (both bullish patterns) & both found strong support at 1.00. Volume is also negligible. So it meets all our 3 criteria - is this the turnaround?

I call a BUY here & as long as prices do not fall below 1.00 (cutloss) , we might just see a turnaround in MTDI. Resistances at 1.10, 1.20 & 1.40. Lets see if this strategy works. Good luck.

Comments:Kulim, Prolexus, Tebrau, Eden

1) Kulim has formed a spinning top with a slight gap above Thursday close. Is this the sign of an inpending top correction? Probably yes as it has run up quite a bit. If Monday price opens below 4.20 & stays that way, then expect a correction & change in trend. Support at 4.06 & 3.90.


2) Prolexus has broken out of the resistance of 0.75 on fairly high volume. The trend is positive & it is above the 10,21 & 30-day MAV. MACD just made a golden cross. It is a trading buy with resistances at 0.88, 1.00 & 1.36. Cutloss is 0.70.


3) Tebrau is still in a consolidation mode, still flat. Support at 0.55 & stronger support at 0.50. A break below 0.50 will be very negative but a bounce back from either support will be a good sign. Volumes have dropped considerably so the selling will probably not be too bad from here on. Daily MACD & RSI are still trending downwards but weekly MACD is still positive. I expect 0.55 to hold up the share & for it to rise again once it breaks out of its descending triangle with a breakout above 0.60.


4) Eden - Is forming a Flag, a bullish pattern. A high vol breakout above 0.60 will be bullish. Next resistance is 0.66, 0.77 & 0.95. Volume has dropped to almost negligible adding further confirmation to the Flag pattern. But a break below 0.50 will be very negative and a definite cut-loss. If you want to trade this stock place a cutloss & make sure you observe the cutloss very strictly. Don't fool around with these type of stocks. However, at 0.53 & above it is a trading buy with extreme caution. Cutloss 0.50.

Update: KLCI, CI Futures & Plantation Index

1) The KLCI daily appears to be losing momentum & is consolidating. Volume has been receding for the last 3 weeks while the MACD & RSI are getting flat. It has tried on several occassions to break the 940 resistance but has failed. What is more interesting is the weekly chart (see attached). There appears to be a spinning top formation this week which may show an impending correction. It still needs confirmation. If Monday opens & closes below Friday's close, then we may have the confirmation. Then the correction will be confirmed & the next support levels are 931 & 925 (the IHS neckline). A correction to the neckline will be good for the market. But a break below this will be bad with next support at 906 & 900. Lets hope it stays above 925.
Interestingly everyone I know is calling for a correction especially the Technical Analysts but so far the market is not complying. However, I think its just a matter of time.


2) CI Futures is still bullish with a bullish engulfing pattern on Friday. There is still a 17 point discount to the KLCI but the margin is narrowing. However 921 is a fairly strong resistance, so it will need some volume to break it. Vol has been rising, so it may happen. I think we have to wait for Monday's action to find the next trend. RSI & MACD are both flat.


3) Plantation index rose again Friday after a week of falling. However this was not accompanied by rising volume. It looks like 3443 will lend it some strong support, so if it bounces off this level then expect to see the bullish trend resume again which will bode well for plantation stocks. However, the weekly chart is showing a spinning top formation. This indicates a possible correction, so if prices open below Friday & stay below that on Monday, we may see the correction which should hopefully be a mild one. The weekly MACD & RSI are rising, so it is still very positive. A bigger correction will take it to the neckline of IHS at 3352 & it should bounce off this & then rise to the target of 3639.