Talking Stock With The Doc

This Blog has been created for the purpose of sharing my ideas on investing on Bursa Malaysia using Technical Analysis. Stock market investing is a science & TA a scientific tool used by investment professionals. TA also has its sceptics but this is an oportunity for you to follow TA based investing ideas. So welcome to my blog and may you "Live Long And Prosper".

Friday, August 18, 2006

Comments Bursa Malaysia

What a day on Bursa Malaysia. If its not Iris its something else. Mobif is the latest "champion" to free-fall from dizzying heights to drowning depths. Together with it went all the other speculatives or maybe in M'sia we should call them "Syndicatives". This shows what a risky place a stock market can be. You might make a million today but chances are you'll lose 2 million tomorrow. Don't blame Bursa or SC, this sort of syndication must be stopped at all cost. Otherwise far too many people will lose all their savings in the market.

So if you want to trade, go for the slow but sure winners, the good stocks in good industries. One example was the plantation industry. You would have made good money without running the risk of disasters like Mobif & Iris.

Take care when trading in the next few days & avoid the "syndicatives".

Updates: CI , Futures, Eden, Leader, Tebrau

KLCI - Surprisingly it rose today. The piercing pattern is bullish & even the Vol is up BUT don't be fooled. I am not convinced that this means the CI will rise from here as it is not convincing enough. Tho the vol is up it is not very high & MACD has made a bearish cross, RSI is down. The 940 resistance must be convincingly taken out & we need to see if it can stay above 940 for 3 days. So I still think it is bearish & will not buy in yet. Lets see what happens on Friday.


CI Futures - Still negative as it did not follow the CI up & remains below the 940 level. Its now at a discount to the CI. Vol is quite low though. Its hard to make a call as it is not exhibiting any major sell/buy signals but its more negative than positive.


Eden - I don't advocate trading these highly speculative & syndicated stocks & I don't buy them but since some of you might I thought I'd blog it here bec I see a very strong SELL signal. There is a strong bearish Dark Cloud Cover candlestick pattern Thurs. When this happens after a large white candle the previous day it is very bearish & indicates further downside. So I would SELL this stock asap.


Leader - Another stock I don't advocate trading but as I see a bad sign I am providing this advise for traders who are involved in Leader. It has also formed a very strong Dark Cloud Cover & when that appears after a large white candle it is very bearish. This is a clear SELL sign as the next move will be down.


Tebrau - No break out . The poor sentiment for penny stocks affected Tebrau as well so Wed's positive move has fizzled out. A descending triangle is bearish but a strong high volume breakout would have been positive but now it has formed a very bearish engulfing candle, so the next move is definitely down. Unless penny stock sentiment improves considerably tomorrow (which I seriously doubt), otherwise it may even crack down below 0.50 & such a break below the lower line of the triangle is extremely bearish & traders must SELL. So keep a very close eye on Tebrau Friday & sell if it breaks down. Next support is 0.45.

Thursday, August 17, 2006

Update: Tebrau

Tebrau - A nice rise today on high volume. Is this the signal that it is going to turn bullish? It closed above the 0.55 resistance but it is still within the confines of the descending triangle. A bullish breakout from a descending triangle (abv 0.57) must be accompanied by high volume. If it does then next resistance is 0.65 & the stronger resistance of 0.725. RSI just turned up but MACD still negative & all the MAV are still flat. We need to see more, but I think it is turning positive. Traders can accumulate with cutloss below 0.50.

KLCI & Futures

1) KLCI - Finally the correction came. The CI was already exhibiting weakness for a few days & the divergence bet declining volume & rising prices as well as a flat daily MACD & RSI were all indicators of weakness. The Harami at a peak on Tuesday was a strong sign that a reversal was coming & even a 130 points rise in the Dow could prevent it. Today's long black candle portends further falls on Thurs/Fri. Support will probably be at 924 the IHS neckline. I don't think we will see a major downturn, it is most likely a correction within a bullis uptrend.


2) CI Futures (FKLI) - No more discount to the CI. Both the FKLI & CI are now the same at 938. We have 2 black candles at a peak so I expect the FKLI also to correct down. There is support at 933 & 921, but I think it will fall at least to 921. MACD & RSI are flat & Vol is moderate, so there are really no bullish daily signals altho the weekly MACD & RSI are bullish. So this will most likely be a moderate correction, not a big fall.

Comments: Plantation Theme

As mentioned in this blog yesterday plantation counters were due for a correction & I had SELL recommendations on all of them. So if you had followed my advise you would have made some decent money & sold out by now. The Plantation index is also correcting with strong support at 3567 which will also be at the centre Bollinger Band. It may not hit that level but if it does & remains above it then we may see round 2 of the run.

Oil prices have also fallen & if CPO remains high, this makes Biodiesel unviable as an alternative fuel. So CPO prices may fall in the short term. H'ever the hurricane season is upon us & all it takes is one major hurricane to push oil prices up & with that CPO prices. For now avoid plantation counters until the correction is over, although it may just be a short correction. So keep a keen eye on this space.

Wednesday, August 16, 2006

CI Futures, KLCI & Tebrau

Futures - Formed a bearish Harami at a strong resistance zone (940). Reversal signal indicating prior trend has ended. Should correct downwards with initial support at 933 & further support at 921. Only question is if the 132 points rise in the Dow today delays the correction.


KLCI - Bearish Harami formation Tuesday. Volume has been declining but prices rising. This divergence in trend is not a good sign. Other indicators are flat. A correction is due but a strong rise of 132 pts in the Dow on Tues may hold it up for a while. If not the question is will it be a minor correction to 939 or 931 or a bigger correction to the IHS neckline of 924? Either way a correction is due & coming.


Tebrau - still no sign of strength. Getting closer to end of descending triangle. Vol is very low. Indicators still negative. Its still a game of wait & see but be prepared to sell if it falls below 0.50. Resistance is now 0.55

Plantation Theme - Sell or Hold?

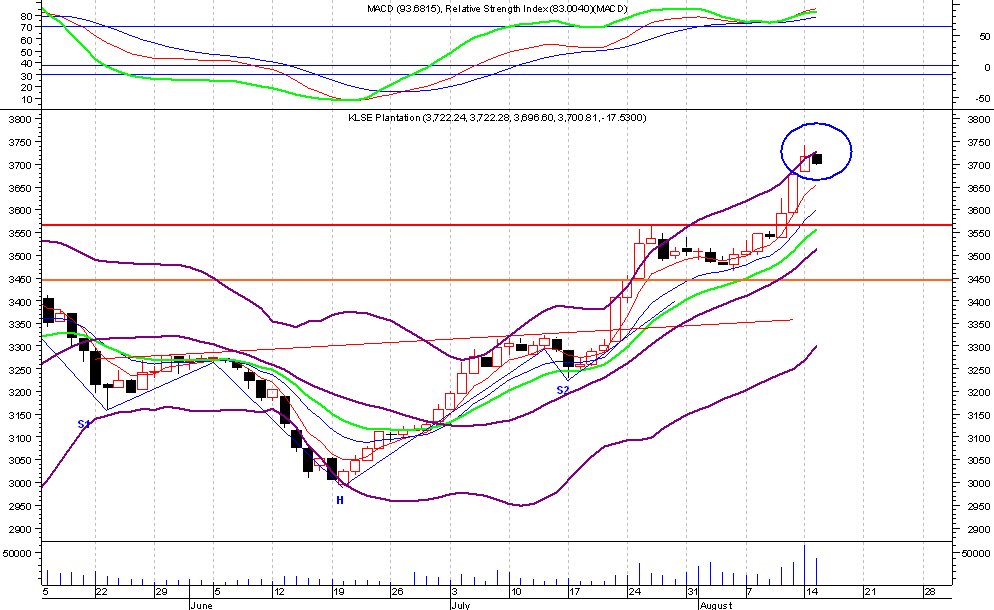
Plantation Index- first black candle after 3 days of white candles. Can portray a reversal or maybe just a minor correction. We need another day to say for sure. However, individual stocks are showing possible reversals. Today is bottom-up trading, as different stocks within this industry may act differently. The smaller players may be in for a bigger correction as we can see below.
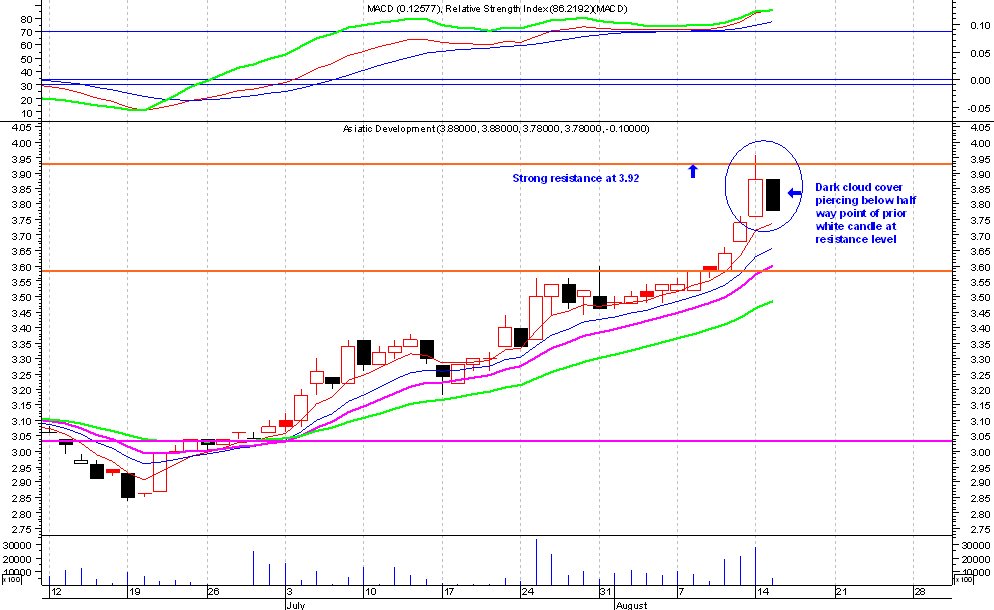

1) Asiatic - very strong reversal bec of the dark cloud cover (DCC) pattern on Tues. A DCC at a strong resistance (3.92) & when it pierces below the half way point of the prior long white candle is a strong signal of a reversal. SELL. Support at 3.58.
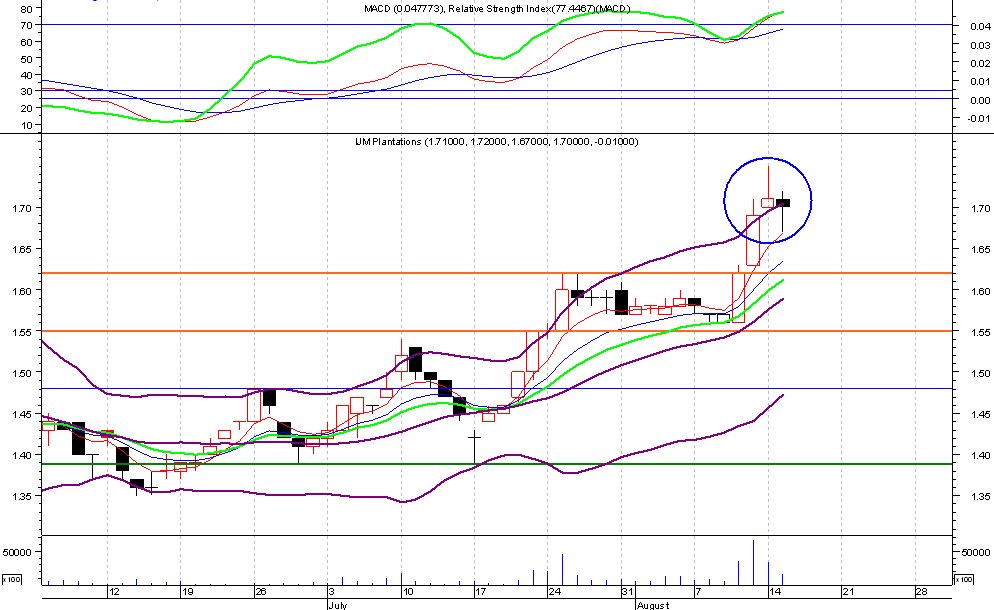

2) IJM Plantation - candlesticks indicate a reversal of the uptrend. On Monday we had a shooting star & Tuesday a hanging man, both are signs of weakness & when they appear at a peak it indicates a reversal of the prior trend. Strong possibility of a downward correction with strong support at 1.62. Traders should sell & pick it up after the correction.
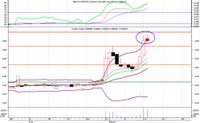

3) Kretam- has formed a spinning top & possible evening star at a peak. If prices do not open & go beyond 0.65 & if it falls below this then a correction is confirmed. Support is at 0.62, 0.585 & then 0.52. If it cannot stay above 0.65, then traders should sell & buy back later.
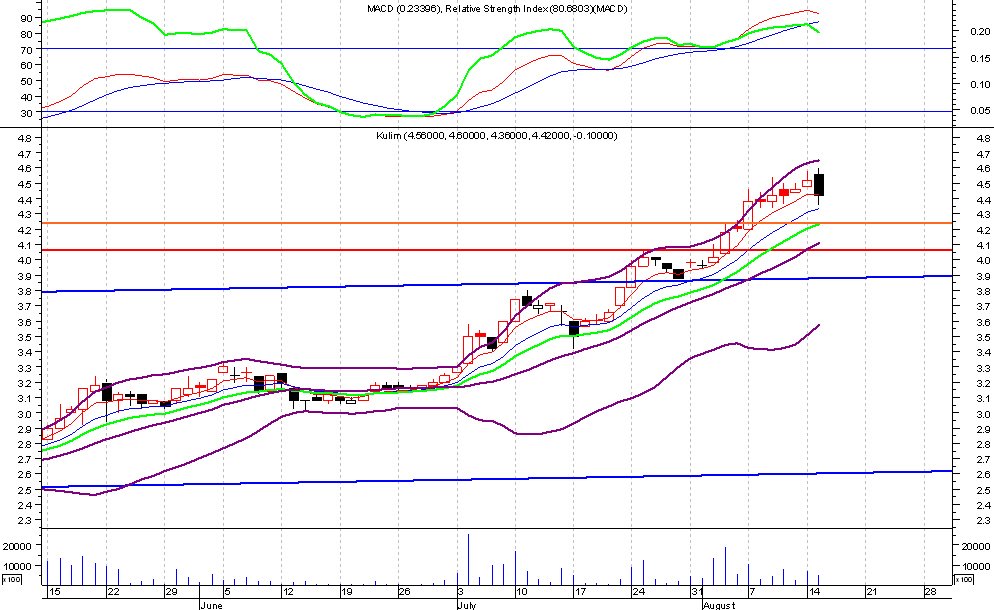

4) Kulim - has formed a large bearish engulfing pattern at the peak of a rally. Though volume is low, such a formation portends a change in trend & a correction is more than likely. Support is at 4.24 & 4.12 (Bollinger band support). Traders should sell Kulim & buy back later.
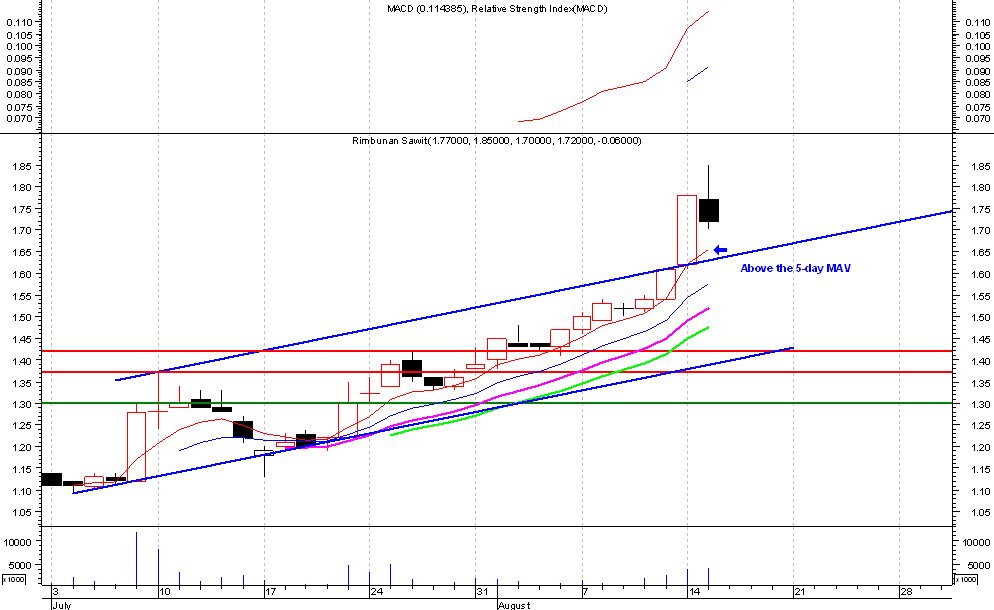

5) Rimbunan Sawit - finally a correction after a big jump on Friday. This is to be expected as it has also risen above the uptrend channel. Technically it looks like a Harami so we can say that is negative. But as other smaller stocks show reversals, RS would not go against trend. If prices do not stay above 1.72 then SELL & buy back later.