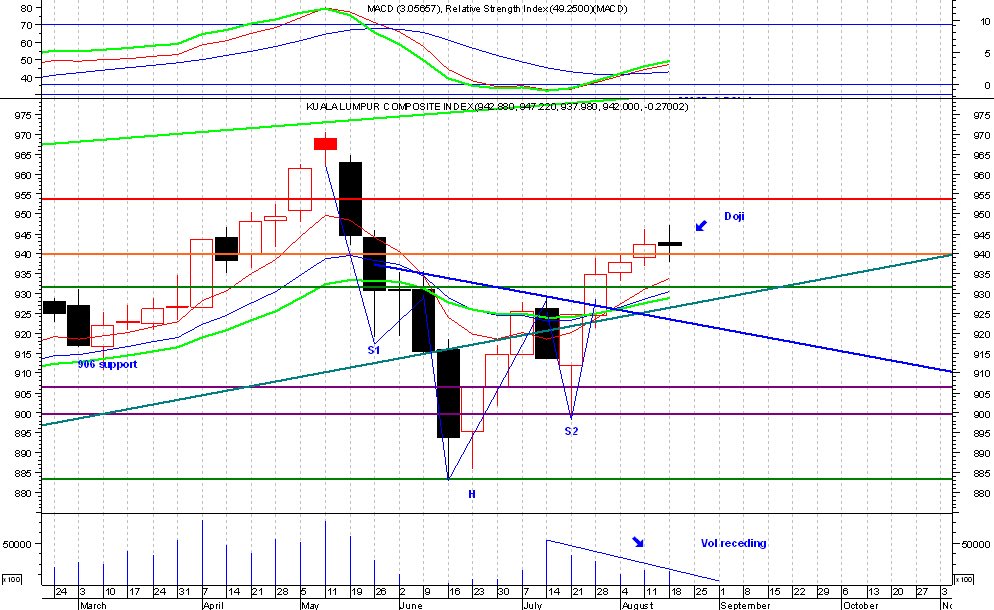
Update KLCI & Futures
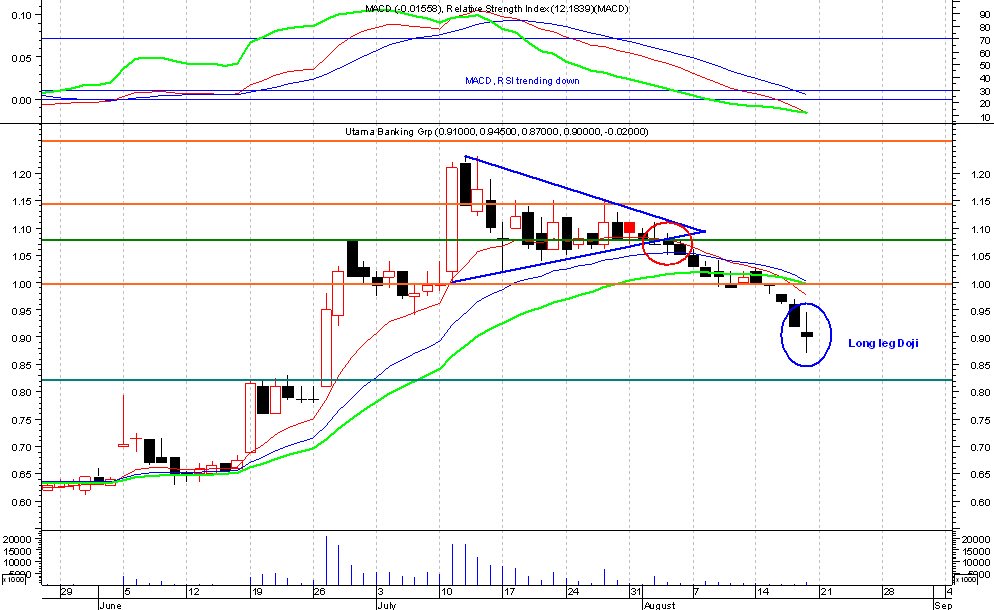
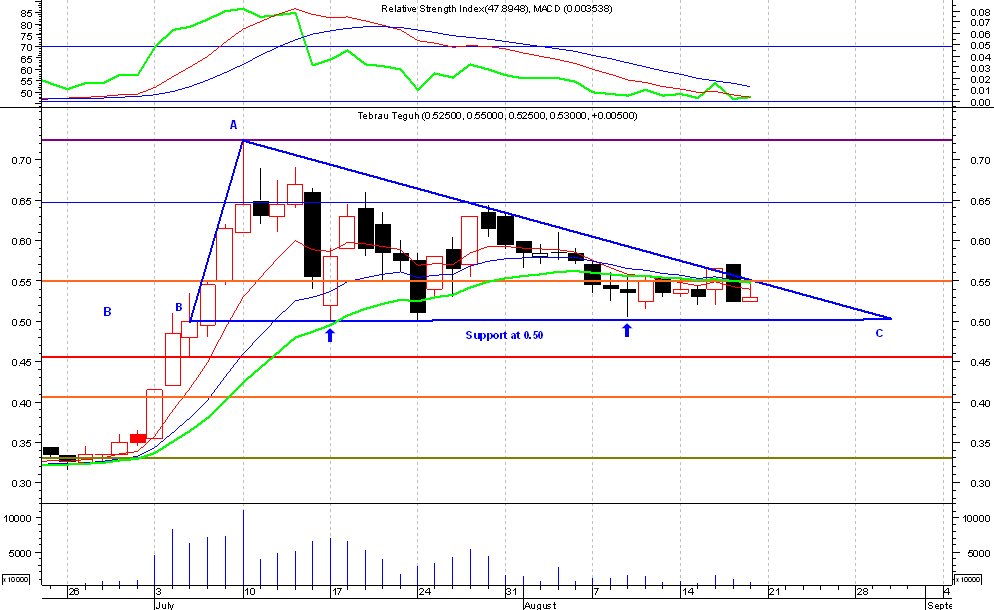
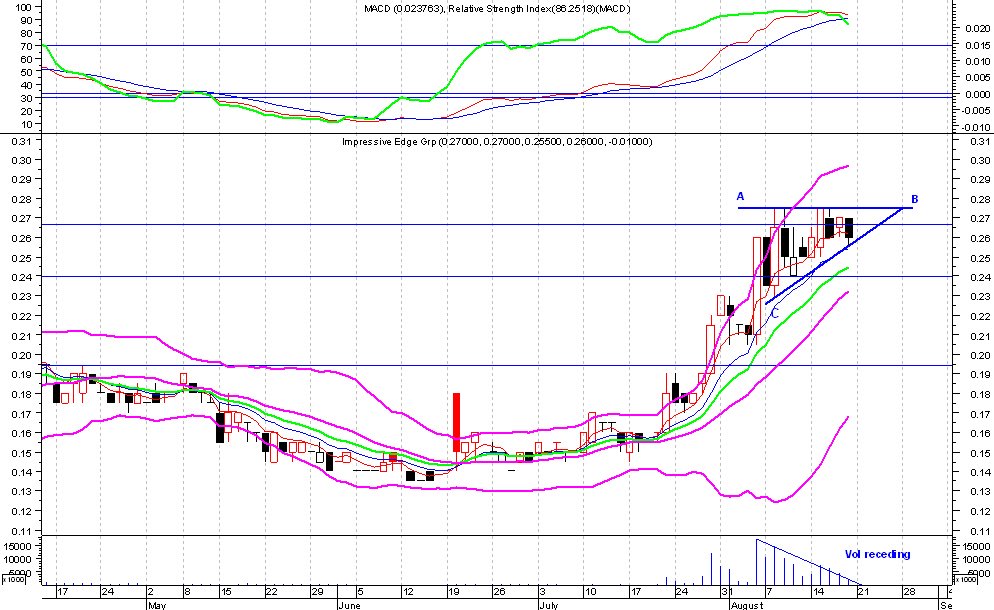
Finally got my data sorted out but some stocks still had some corrupted data. Took some time to correct then all. However, I see no significant changes in many of the stocks we have been following so I didn't find it necessary to post them today.
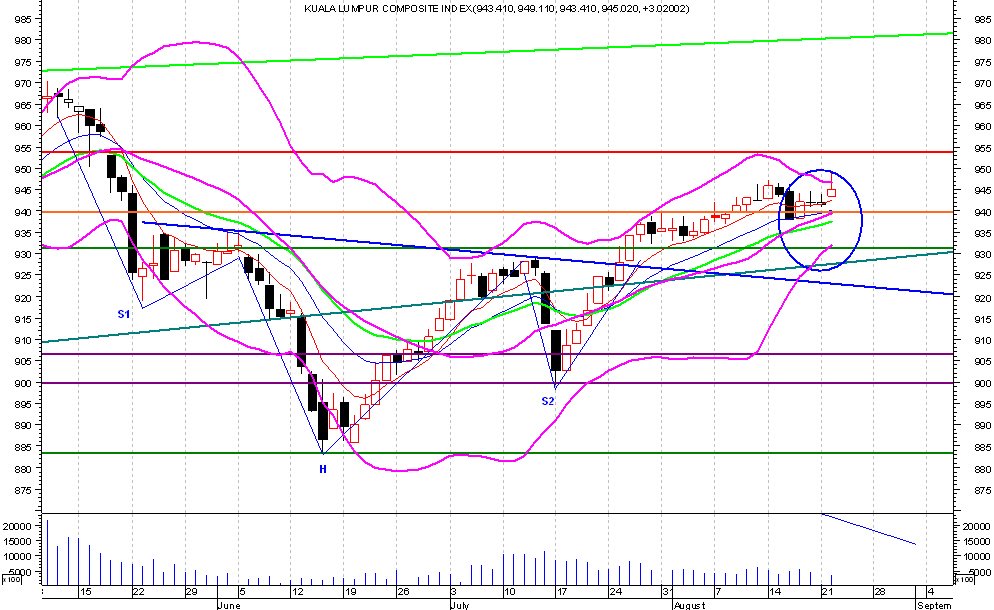
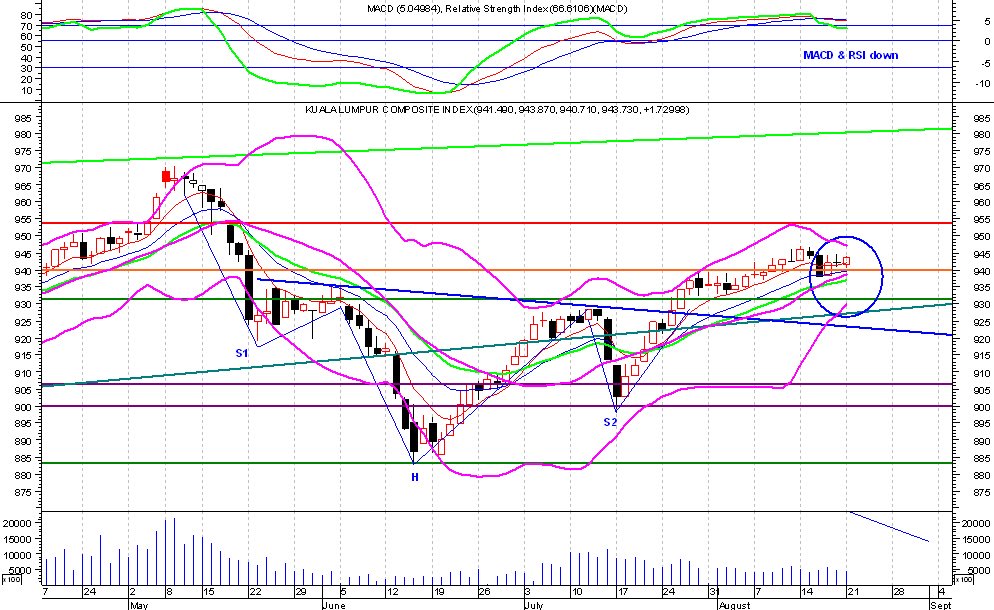
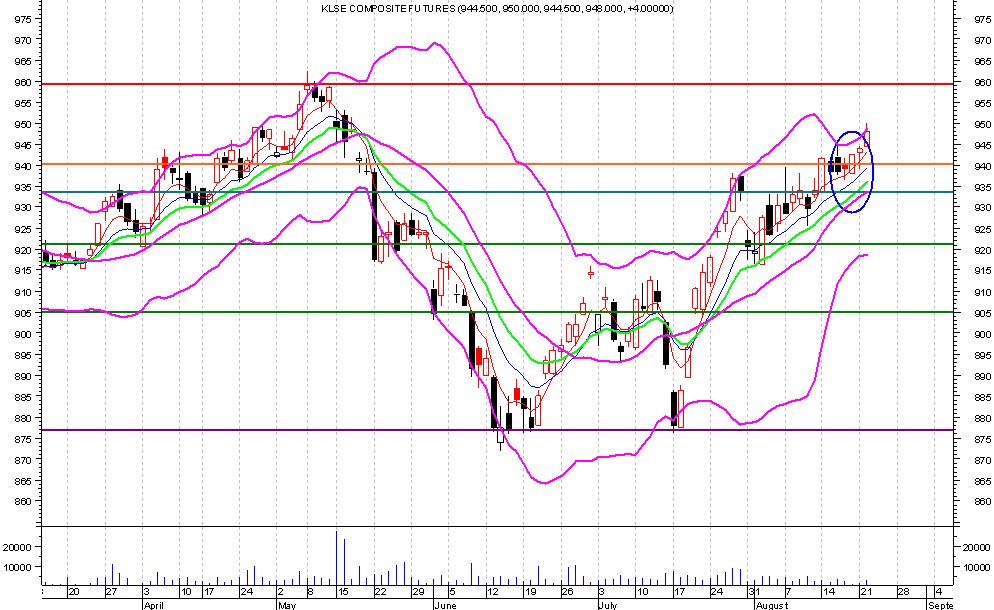
KLCI - Is still rising, but my concern is that volume is still very low. If Vol remains low it will never penetrate 950 so we may have a flat CI for a while. Two issues will be of concern to investors. Firstly whether Bank Negara will inc interest rates at their meeting on Friday. China increased its rates by 0.25% on Monday, will M'sia follow. If there is no rate inc, then the CI may fly, if there is then expect a big correction next week. Secondly of course is the budget on 1st Sept. Investors want to see what's on offer. Expect more money for construction, announcements of some major projects, more money for agriculture & aquaculture and the usual suspects, tax on alcohol & cigarettes. So if there is no rate inc & the budget is favourable, then construction stocks will do well post-budget. UEM World & Builders, Gamuda & IJM would be the picks.
In terms of TA, RSI & MACD are still flat, index is up but on low volume, support is at 940 & strong resistance at 950.

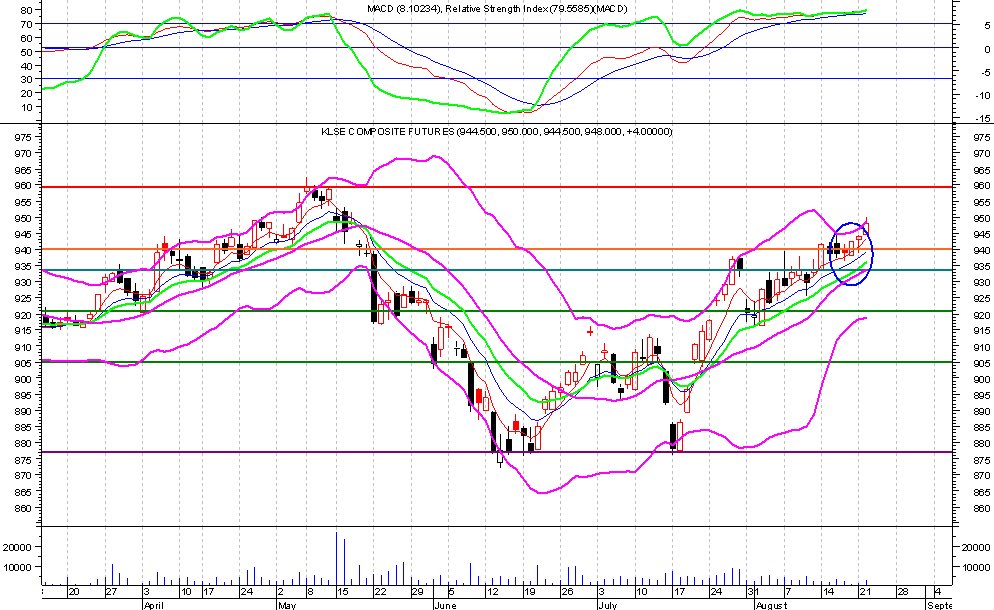
CI Futures - Is also rising & is maintaining the premium to the CI. It is actually looking quite positive but I expect the same factors as above will affect it. Resistance at 960 & support 940.
posted by Dr. Siva @ 7:31 am
2 comments
![]()
![]()