Talking Stock With The Doc

This Blog has been created for the purpose of sharing my ideas on investing on Bursa Malaysia using Technical Analysis. Stock market investing is a science & TA a scientific tool used by investment professionals. TA also has its sceptics but this is an oportunity for you to follow TA based investing ideas. So welcome to my blog and may you "Live Long And Prosper".

Saturday, September 16, 2006

Time To Buy Battered Up Syndicated Stocks?

This week was a very interesting week for all those recently battered up & bruised syndicated stocks. Many had fallen anywhere from 50 to 75% from lofty unsustainable highs to perhaps some ridiculous lows. Thats the problem with syndicated plays, on the downside even real values can be ignored during panic falls. However, I have been waiting for a sign that the correction may well be over & that the time for syndicated plays to return has finally come. Syndicated stocks never die...they may fade for a while but they will always be back.

Before we look at stocks, what signal or pattern am I looking for to indicate a reversal in trend? The most important is a bullish candle, the Bullish Engulfing Candle (BEC) pattern. When we find a BEC at price bottoms it is a strong indication of a trend reversal. We have seen that in the futures daily chart where a BEC in mid August caused a strong reversal of the futures into a strong bullish formation that went up from 874 right up to todays high. When this happens in a weekly chart the pattern is even stronger. Remember it must happen after prices have fallen badly, then only is the reversal very strong & bullish. In all these cases the Daily MACD & RSI are +ve & rising, weekly RSI are flattening & starting to show possible rises. Weekly MACD lag prices but are a low levels.

The downside in all these cases are is limited because you are buying at the bottom and the risk-reward ratio is high (except for Iris, I would not recommend this for the faint-hearted).

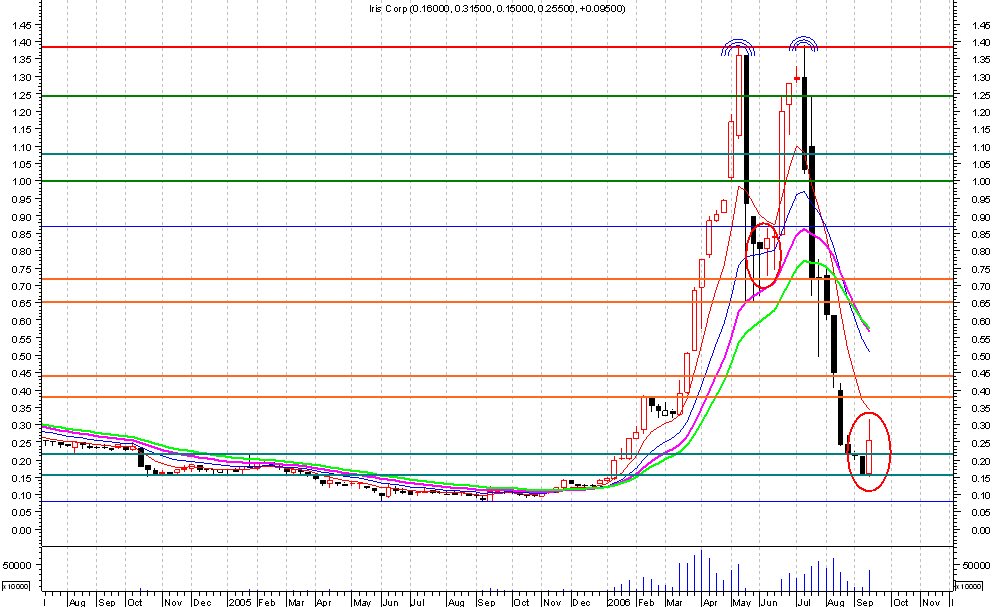
Iris - we start with the grand daddy of them all. Despite falling from a double peak of 1.38 punters have still been chasing this stock. Amazing, I don't admire their stupidity but you have to give them credit for sheer guts. The recent falls h'ever were very bad & it fell from 1.38 to 0.15 a whopping fall of 89%. But last week it formed a strong BEC off a strong support at 0.16. This is very bullish. Resistances are at 0.38, 0.44, 0.65 & 0.72. The signs are that it will rise next week but I am very very wary of this stock so I advise traders to keep an eye on this but don't buy if you are the cautious type. There are equally good buys below.


MTD Infra - fell from a double top high of 1.52 to a low of 0.93, a fall of 39%. It fell to the strong support of 0.94 & formed a strong BEC last week. This happened twice before to MTDi & both times it rose off the 0.94 support to a high of 1.50 giving gains of 58% each time. The BEC this time is large & strong, so next week we should see good upside. Resistances at 1.10, 1.20 & 1.40. If prices reach 1.40 gains will be 36%. BUY with cutloss at 0.93.


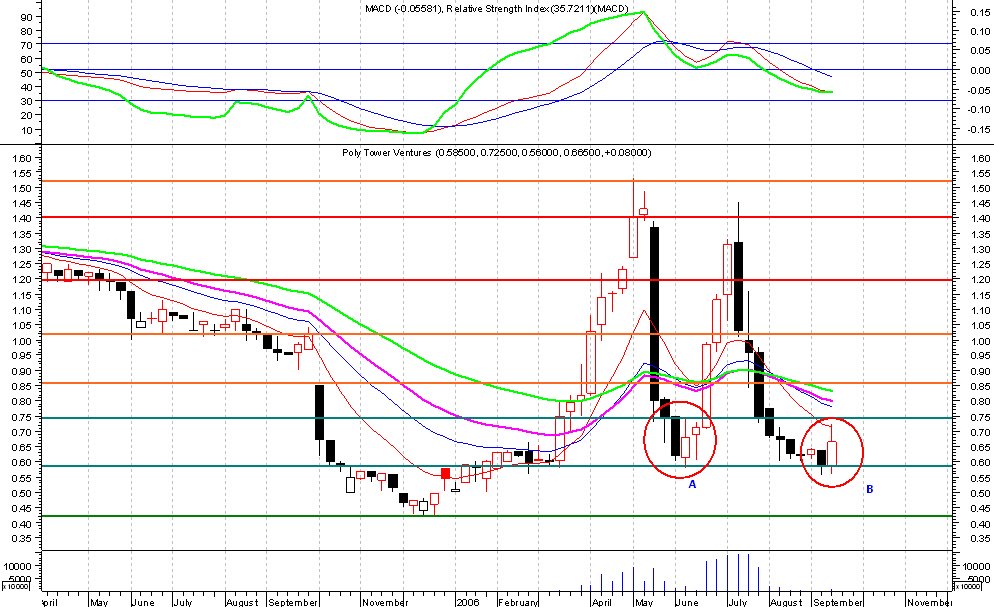
Poly Tower - fell from a high of 1.45 to a low of 0.555, a 62% fall. It hit the bottom of 0.555 the previous week & last week rose to form a BEC. The last time PTV too a big fall in May/June it reversed when a bullish piercing candle formed at the low & it rose from 0.58 to 1.45 for a huge gain of 150% in just a month. Last week's BEC at a strong support level indicates the correction is over & prices should reverse up. Resistances at 0.74, 0.85 & 1.00. Very strong resistance at 1.20. Even if prices hit 1.00 this gives a gain of 50%. Buy with cutloss at 0.57.


Satang Jaya - fell from a high of 2.38 to a low of 0.985 a 59% fall in just 2 months. It found support at the historical low of 1.00 (+/- 0.015) & this week it formed a strong BEC. Price falls on Wed & Thurs & a small rise on Fri have basically corrected the strong rise on Tues. BEC at a strong support level is very positive. Resistances at 1.11, 1.18 & 1.30. Further Resistance at 1.52 & 1.60. Even a rise to 1.30 will give a return of 20% but likelyhood of a rise to 1.52 is strong (returns 40%). BUY with cutloss at 0.985.


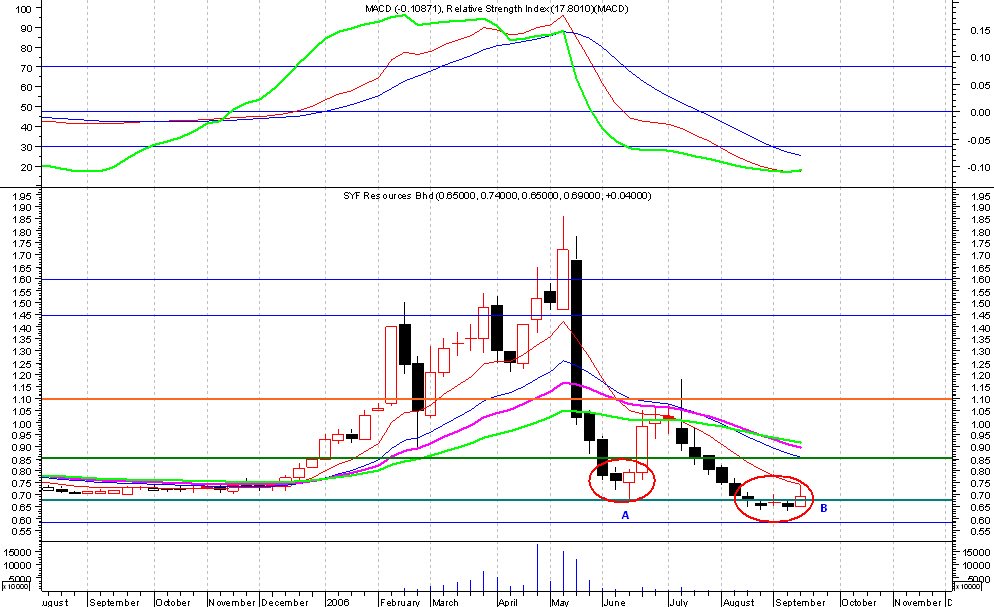
SYF - fell from a recent high of 1.18 to a low of 0.63, a fall of 46%. It started rising off its lows on 8, 11 & 12 Sept & then fell for 3 days. Despite the 3-day fall it still formed a BEC (see B on chart). The same BEC formed after the previous large fall from a high of 1.86 to a low of 0.68 (May to June - see A). That BEC preceded the rise from 0.68 to 1.18 a gain of a whopping 73%. If the BEC is true this week then prices should rise from now until resistances at 0.85 & 1.09 for a potential gain of 58% (if it hits 1.09). Buy with cutloss at 0.62


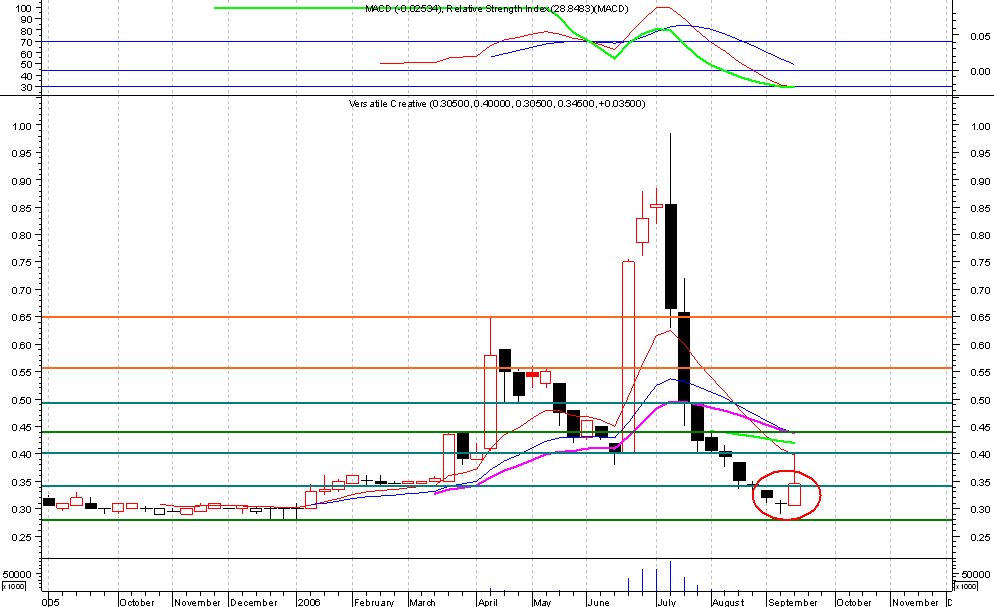
Versatile - fell from a high of 0.985 to a low of 0.29 a staggering 70% fall in almost exactly 2 months. At the bottom we saw a Doji the previous week & this week a strong BEC. Is this an indication of the reversal to come next week? After a strong rise on Tuesday it has corrected for 3 days yet shows a weekly BEC. If we follow CS charting this is a strong buy signal. Resistances are at 0.40, 0.44 & 0.49. If it can cross this then next res are 0.55 & 0.65. Even if prices rise to just 0.49 thats a 42% gain. BUY with cut loss at 0.29.

Update KLCI & Futures

KLCI - is still in bullish mode. Prices remain above support of 953 & within upper channel of Bollinger Band. It is also riding the 10-day MAV upwards. No golden cross of daily MACD yet but RSI has stopped falling & should move up again if prices go up next week. Weekly MACD & RSI are still positive.


FKLI - CI Futures are also in bullish mode. Trending upwards & is above the resistance of 960. Another 2 days above 960 will be very positive. Daily RSI trending up & MACD is close to making a golden cross. Weekly MACD & RSI are +ve & the weekly candle shows a bullish trend as well. It is just 2 points above the CI & signs indicate continued uptrend next week.

Friday, September 15, 2006

Update: KLCI & FKLI (CI Futures) & Theme Plays

FKLI- made a very bullish move off the mid-Bollinger Band line today. Next it has to breakout from the strong 960 resistance. A strong high volume b/out would bring it into bullish territory. All we need then is for the Daily MACD to stage a positive crossover & for the BB to rise & expand. RSI seems to have bottomed out at 38. Weekly RSI & MACD are positive. Again any fall back should be strongly supported at the mid-BB line. It will only turn bearish if it breaks below this line. The 10 & 30-day MAV is also providing support. Now if only Vol was higher.... Anyway, I called for going long yesterday & those who trade futures would have been amply rewarded with a 7 point rise. Anyone want to buy me teh tarik & roti canai? ...8))


KLCI - is still finding good support at the mid-BB line & support level of 953. A breakdown below these 2 supports will be negative. However, Futures is now at a 3 point premium to the CI & that is a positive sign that perhaps the main market will soon trend upwards. So maybe the correction is over at the 953 support level. Traders could start accumulating good stocks at this level but keep an eye on the mid-BB & 953 support & be prepared to retreat if they are broken.


Themes - There also seems to be a new theme play (of an old theme play) i.e. construction stocks. They seem to be moving up strongly this week with IJM, Road Builder, UEM World & MTD all positive. I will do a thematic review this weekend but these are starting to look good again. Traders may want to consider accumulating some of these stocks selectively. Do your analysis before picking stocks.

Another theme play that moved up Thursday is palm oil stocks. However, we need to see if it can be maintained or whether its just a technical rise which will not hold up next week. Again I will do a review on the weekend.

The most interesting is the Penny Stock Theme Play. I have been monitoring these under my "Buy when no one wants to buy" strategy & many of them are starting to show bullish signals, mainly strong weekly candlestick bullish engulfing at the bottom. This is how the last play started & now we are seeing them again. As long as prices of these stocks either stay flat or move up today (Friday) the pattern will confirm. Stocks incl here are PolyTower, Satang, SYF, Versatile, MTD Infra, Oilcorp & even the dreded grand daddy of them all IRIS. I will do an analysis over the weekend once the weekly chart is complete for the pattern.

Happy trading.... 8))

Wednesday, September 13, 2006

SJER Theme Review - Mulpha, Tebrau, UEM World

As requested by Goldman, perhaps its time for a review of the SJER theme.

1) Mulpha - is quite resilient. Despite overall market falls it has managed to remain within the upper BB channel & also above the 10 & 30-day MAV & 1.20 support line. Daily MACD & RSI are positive altho the weekly are negative & falling. As long as it stays in the upper BB channel its fine & a breakout above 1.27 will be very bullish but that may take a few attempts first as it is a very strong resistance. You can buy & hold this with a cut loss below 1.19.


2) Tebrau - is this a one day wonder? Nice long white candle on Tues & then a long leg Doji today. If tomorrow prices open below 0.455 & stay below then it is confirmed -ve & it should fall back. Daily RSI turned +ve Tues but MACD still has not made a golden cross. Weekly MACD & RSI still -ve.

Also today prices were stopped righ at the mid BB line. It couldn't cross this & the BB is still falling. I view this as -ve. It must also cross above the downtrend line (A-C) currently at 0.49 which is also the point of the mid BB line. Double jeopardy, prices stopped by midBB & downtrend line so 0.49 is a strong resistance now for Tebrau. If it crosses above this tomorrow then it will be +ve if not then prices will continue their fall & its a one day wonder confirmed.


3) UEM World - is looking positive but with a caution because it is still within a Descending Triangle (A-B-C). A DT is generally a negative pattern but within this, UEMW has some positives. It hit the lower BB line & bounced up to cross above the mid-BB line. The BB also narrowed but with today's close is opening up again. If prices can stay in the upper BB channel it will be +ve. The other positive from this is that it bounced off the strong support line at 1.29 which was also the point from which it bounced off the BB. When this happens it is positive. Daily RSI is rising again & MACD just made a golden cross.

On the negatives it was stopped at the 1.50 resistance line so tomorrow's price action is crucial. Vol is also still low. Weekly RSI & MACD still -ve. Finally it is still below the downtrend line (B-C) which constitutes the DT & a strong resistance. It must break above this line on high Vol for it to turn bullish. Next 2 days will be interesting. Cut loss is at 1.29, a fall below this is very negative.

Analysis: KLCI, FKLI (CI Futures) & Dow Jones

KLCI - seems to be holding out reasonably well. Technically positives are:
1) I especially like it that the mid-Bollinger Band is giving it solid support. BB is still in rising mode & it has not turned downwards. If it can stay within the upper BB channel then index has the potential to rise again from here.
2) The support line of 953 is holding up well so far.
3) A bullish Hammer has formed & when this happens at a support line it is positive. This has formed at the mid BB line so technically it is a good sign showing that buyers are coming in at the support line
4) It is also comfortably above the 30-day MAV another good support line for the index
5) Weekly MACD & RSI are still positive.
6) Finally Vol is rising, even though it is 40% Mesdaq volumes, but that was also the case earlier in the year & in June/July. If this Vol is maintained it is a good sign that maybe Buyers are returning to the market.

Technical negatives:
1) Daily MACD & RSI still turning down. But this may lag the market a bit & if in next 2 days market moves up, then they should reverse upwards.
2) Hmmm hard to find other negatives altho the last minute push to keep the CI up over the last few days does not give a true picture of the market. But this has happened before & in the end the support was enough to keep it steady until selling pressure dissipates leading buyers to come in & the market to rise.

Fundamentally:
1) Oil price falls are a good sign not just for the CI but for global economies. It eases inflationary pressures & may mean the Federal Reserve will hold rates steady, good for us & the world economy.
2) Commodity prices have also been falling & this eases raw material pricing pressures & eases inflation concerns.
3) Tun Mahathir's tirades against the Govt will still be there but it will be of less concern to everyone incl foreign investors. Reuters carried a report on Monday entitled: "UMNO Humbles ex-Premier Mahathir". Foreigners will take such headlines to mean they can worry less about Tun & that the PM's hand is stronger. Unless Tun can come up with some really dirty laundry on Pak Lah, otherwise this is less of a concern for now.

Overall, the CI is looking positive again. The one signal we must watch is the mid BB. If index falls below this then be prepared to get out, if not then the bear is losing & the bull may just be on the verge of returning.


FKLI (CI Futures) - the same comments hold for Futures. It is following the same trend as the CI & also has support at the 10 & 30-day MAV. As long as it holds above the mid-BB it should move up. Going long is indicated here with a sell order in place if it falls below the Mid-BB.


Dow Jones is bullish. BB is rising & index is in the upper BB channel & rising. Weekly MACD made a golden cross early Sept & weekly RSI is +ve. Daily MACD is about to make a +ve cross. Volumes are rising. With falling oil prices & rising corporate profits prices are being well supported. Falling commodity prices ease inflation worries & the bet is that Feds will hold interest steady. Only worry is a falling housing industry but economists seem to think it will be a soft landing, I am not too sure about that. Regardless, TA is positive on the Dow. A rising Dow will lend support to world markets & that will also support the CI.

Update KLCI, Futures & Penny Stocks

KLCI- made a hammer pattern yesterday & bounced off the middle Bollinger Band line. Ordinarily that would be a bullish signal but the only problem is we all saw that it made about 2 points up in the last minute before market closed. Thats what my friend Isaac calls the "magic last minute push". If it wasn't for that bit of magic, we would instead have a black candle & not a hammer. That is one problem with using TA in M'sia, sometimes TA looks good but the underlying issue is manipulation to make it look good. So a one day candle is not good enough & thats why I always look for a few days before making a call on the market. So I would prefer to wait for further signals before I make a "state of the market" address in this blog. And the volume is not related to the CI its mainly because of the play up in the penny stocks.


FKLI - the futures seems to be still in corrective mode. No new signals to change my opinion that it is still bearish.


Penny Stocks - "One day of sunshine does not a summer make!" Penny stocks surprised us with a sudden high volume & price rise yesterday. There were no major reversal signals on the charts Monday to indicate this rise. All I can say is that the syndicates must have decided that prices have gone low enough to start playing the market again. This will probably bring all the market punters jumping in to buy penny stocks because they are afraid they will miss out on a new bull run. They may just lose another pair of pants by doing that. For me I will wait a few days to see how this turns out. If prices rise for another day or two, then have a mild correction & THEN rise again, then maybe, maybe I may enter some of the better stocks. Until then I will just watch the market. Better to be safe than sorry.

Sunday, September 10, 2006

Analysis: KLCI & FKLI (CI Futures)

Last week was a significant week for the market & for M'sia politically & economically. Politically Tun Dr.M, the most ardent critic of the PM & the Govt dramatically lost in his attempt to win a delegates seat to the UMNO Assembly from his old stronghold of Kubang Pasu. He polled 9th out of 17. Only 7 delegates were elected. His son also bore the brunt of the backlash & only polled 5th. In 2005 he was 1st. Politically it was a severe embarassment for Tun & strengthens Pak Lah's position. If even Tun's own stronghold does not support him then he can never say that he has UMNO's backing. But knowing Tun he will find another excuse to speak out but definitely his strength politically has waned & he can say what he wants, but this is the final straw & he has now been put to pasture. Thanks for everything Tun, but long live the new PM.

Without Tun's criticism perhaps Msia can get back on track to doing what we really should be doing, building up a new economy based on human capital, new technologies & new initiatives.

Economically Budget 2007 & 9MP should boost the economy & keep it humming despite fears of more interest rate hikes & a recession in the US. Fears - maybe there will be a soft landing, we don't know that yet but a slowdown for the next 3 years can be expected. Msia will also be affected as the US is our major trading partner, so we need to keep domestic demand up & Govt pump priming will be very necessary.

KLCI - we saw the expected correction at the 970 level. The rise from 900 pts is unsustainable without a decent correction. The question is at what support level will the CI stabilise & reverse back into a bullish move upwards towards my target of at least 1021 by Chinese New Year 2007. Is it 950, 940, 921, 900 or 883? I analyse the CI here & compare it to the last fall from a Rising Wedge (RW) in May 2006.

Chartwise, Friday the CI found some support at the 10-day Exponential Moving Average (MAV) & formed 2 spinning tops (almost Dojis) on Thurs & Fri. The 2 ST can mean a possible reversal but it is unlikely, more likely it is just indecision. H'ever Vol even when falling has been low, so there is no large scale selling. Is that because retailers are out of the market bec of previous falls in penny stocks like IRIS, Mobif, etc? Maybe or maybe institutions are still holding on to their blue chips.

On the positive side, prices remain above the middle Bollinger Band within a still rising BB. It is also above the 10 & 30 day MAV (red & green lines) & above the 953 support line. Contrast that with May when it fell below all the above. When prices fall below the BB, MAV & support then we know for sure that it will be very bearish. So for now the optimists may hope that the correction may be short (but I doubt it).

On the negative side, RSI has fallen sharply & MACD has just made a bearish cross. The same thing happened in May & it was followed by big falls in the index.

So what to do next? Well, overall the index is weak. Will we see strength & buying coming in to push it up again this week? I doubt it. But technically speaking it is weak but not totally bearish. H'ever this is not the time to enter the market. Signs are that there is a greater likelyhood of a fall than a rise. I will watch the market for it to show its direction. Will it fall below the mid BBline, will the MACD fulfil the bearish cross, will it fall below th 30-day MAV & 953 support? Or will it give us a strong white candle & move up again. These are signals I will watch out for & until then I will wait patiently by the sidelines.


FKLI (CI Futures) - formed a bullish engulfing candle on the daily chart at the middle BB. Interestingly in May at the same point (mid BB line) it formed a white harami candle, normally a bullish sign, yet the next day it fell below the BB line. Will this happen again tomorrow? I am not into crystal ball gazing, but thats possible bec FKLI has a bearish MACD cross, falling RSI & the white candle had low Vol (so its not very convincing). Will the 940 support hold? If it falls below the BB line, 940 & 30-day MAV (green) then will see bigger falls as happened in May. 921 & 905 provide possible strong support if it falls.


Another strong indicator of bearishness is the weekly candle which is showing a very bearish black engulfing candle. We should never ignore the weekly candles which to me are even more important than the daily. Based on this the Futures is in for a definite fall this week. A good opportunity to short the FKLI.


Overall Analysis: The CI & Futures are still going to fall. Futures are also at a 7 point discount to the CI & if it falls further the CI will also follow. So the market is still in a very bearish state.