Talking Stock With The Doc

This Blog has been created for the purpose of sharing my ideas on investing on Bursa Malaysia using Technical Analysis. Stock market investing is a science & TA a scientific tool used by investment professionals. TA also has its sceptics but this is an oportunity for you to follow TA based investing ideas. So welcome to my blog and may you "Live Long And Prosper".

Friday, July 28, 2006

Comments: Eden, Jadi, Polytower, IPower

I am providing these comments on the request of readers. I know some of you have been badly hit hence these comments. Personally, with the exception of Jadi, I will avoid these stocks because they are only speculatives & very risky.

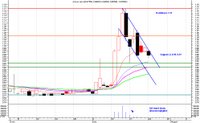
1) Eden - Its too early to tell bec its the first day of correction after the big rise. Support is at 0.55 & 0.52. A fall below 0.52 will be very negative. Resistances at 0.665 and 0.77.

2) Jadi - Its consolidating at the 0.30 - 0.325 levels & just at the 10 & 21 day MA line. Healthy consolidation, low volume. Breakout above 0.325 on higher vol will be positive. Other signals not positive yet.

3) Polytower - no positive signals. It is still consolidating at very low levels. Low vol. Needs to break 0.92 to turn positive.

4) iPower - starting to consolidate at low levels, no volume. No positive signals. Needs to break above 0.95 to turn positive.

Generally for Jadi, Ptower & iPower, there are no buy calls for any of these shares. However, it seems that the major selling may be over & they are consolidating. Jadi is in a slightly better position but still no buy call.

Update KLCI & Futures

1) KLCI is again in positive territory at 936. Thats the 2nd day of closing above the 931 resistance. If it can stay above 931 for another day, then breakout is confirmed. The only issue I have is a lack of vol. Higher vol is desirable. Downside support is now 931, a break below this will not be good. Assuming it stays above 931, then we have a confirmed IHS with target of 976/980. On positive side index is above the 10,21 & 30-day MA, Daily RSI & MACD are positive. Weekly MACD turning up but still no golden cross yet & RSI is turning up too.


2) KLCI Futures has performed amazingly well. It broke through the 921 & 933 resistances strongly & though the Doji star appeared the formation was not completed because the index shot right up. Its now coming to resistances at the 940-944 band (blue arrows) & a tougher resistance at 960 (red arrows). It has been moving right up since it hit the 876 support so we should expect a correction but so far it has not disappointed us. Maybe 940/944 will slow it down. Maybe but I am sure 960 will!

Thursday, July 27, 2006

BUY CALLS: Tebrau, RHB, Utama

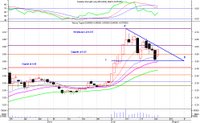
Tebrau (BUY)- Finally it has broken out of the Descending Triangle on higher vol. Positive signs - MACD starting to turn up, RSI is up, 10 & 21-day MA provided good support, support at 0.55 held up & 0.50 is very strong support. This is the buying opportunity for Tebrau. Target 0.84 & 1.08 if there is aggressive buying. Initial Resistance 0.72. Cutloss below 0.55.


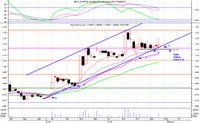
RHB Trading Buy - Has come to the base of the channel which has provided support now on 4 prior occassions. Trend followers may want to buy here as odds are that prices will rise from here. Also Utama is on an uptrend, so RHB will follow. MACD & RSI still down but the 10 & 21-day MA are providing good support. Target 1.32 then 1.54.
A tight Cutloss is below 1.15 which has been the low on several occassions recently (green line) but aggressive players may cut loss at 1.10 (10%).


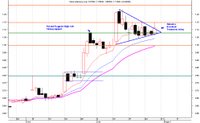
Utama - Is almost breaking out of the 2 week symmetrical triangle. Vol is higher. If it opens up on high volume Friday, then it will be a buying opp. Resistance 1.23 & 1.37. Target 1.37. It is also supported by the 10-day MA & 1.08 support level. MACD still down but RSI is flattening & may turn up. Cut loss is below 1.07.

Wednesday, July 26, 2006

Update: Tebrau

Tebrau is still within the descending triangle (DT). So far attempts to break out of the DT have failed on 4 occassions, so unless there is really high volume & a real push, I feel that Tebrau will find it difficult to breakout. It is coming close to the edge of the triangle so something needs to happen soon. Daily MACD is negative & RSI is flat. Weekly MACD is still positive but RSI is also flat. So the pattern is increasingly turning negative.

Support is at 0.55 & strong support at 0.50. A break below 0.50 is very negative & in a DT such a breakdown is very bad. If that happens I can see Tebrau falling back to 0.45 first then 0.40 & the very strong support at 0.33.

Will the impending announcement this weekend by the PM on SJER be the catalyst needed to push Tebrau up for the next run? Its hard to be sure, but its best that traders keep their stop loss targets very tight just in case the DT breakdown happens.

(Sorry no chart today, Blogger is acting up. Yesterday chart still applies)

Update: KLCI, CI Futures & Plantation Index

1) KLCI - has crossed over the 931 resistance on increased volume tho' volume is still not significant (i.e. it has not exceeded 1 billion shares). This could mean that it is confirmation of the IHS with just 1 shoulder. However, for confirmation I would like to see the index stay above 931 for at least 3 days, then only can we confirm the breakout. If it falls back below 931 then the breakout is false & we may still see one more round of consolidation before the true breakout happens.


2) KLCI Futures - Truly amazing the strength of the CI Futures, it blasted through the potent Doji Evening Star & closed well above it at 929. The margin between the Futures & daily KLCI is now just 5 points. Does the futures have enough legs to cross above the CI? That would be bullish for the CI in the near term. There is a strong resistance at 934, so that may cap it for now. But Daily RSI & MACD are still positive & rising, Weekly MACD is rising but still negative yet to make a golden cross. It will be interesting to see if 934 will stop this baby. Anyone who went long at the bullish engulfing pattern at 877 support on 18 July will be laughing all the way to the bank.


3) Plantation Index - has formed a potential shooting star, so we may see a minor correction. Support is at 3443 the previous strong resistance. With rising palm oil prices I believe that this correction is just to correct the overbought position in plantation stocks & after a correction the rise will continue. This is also based on the fact that the weekly MACD just made a golden cross, weekly RSI at 58 & rising is just in the early trend of rising. Daily MACD is still positive & RSI at 84 is slightly overbought but still has room to move up.

Update: Tebrau, Kulim, IJM Plant & Johor Land

1) Tebrau - Is this the time to buy Tebrau? It has formed a Descending Triangle [DT] (marked as A-B-C in chart) with support at the base of 0.50 (B-C) which supported Tebrau's prices on 2 occassions. In TA a DT is not a good sign. A fall below the base will be bad & a cut loss should be placed below 0.50. For the picture to turn positive it must break out of the DT at 0.60 with much stronger volume than Tuesdays, at least 750k to 800k lots. A break below the triangle will trigger massive selling & support of 0.45 may not hold. On the positive side Tuesday's candle can be called a piercing pattern & is a strong sign. But is it time to get back in? I would wait for a breakout above 0.60 first.


2) Kulim - Since I made my call on Friday 21 July, Kulim has risen strongly. Daily RSI at 75 is just slightly oversold but still has room to move up, MACD is positive. But after 6 continuous positive days we will probably see a correction soon, maybe today. However, the support at 3.85 should hold & after a small correction prices should continue to rise. BUT watch palm oil (CPO) prices, if it starts falling then Kulim will too but this is quite unlikely to happen soon. CPO prices are on the up & up.


3) IJM Plantations - Has also been rising like Kulim. It has been stopped at the all time high of 1.62 on Tuesday. There may be a small correction, but after that it will continue rising again. Same story as Kulim.


4) Johor Land - Although prices rose yesterday there was no volume, so this is NOT a Flag breakout. We can draw a new Flag/Channel & prices still have to break out on strong volume for confirmation. Wait for that.

KLCI & Futures - Doji Evening Star in Futures

KLCI - the rise on Tuesday is not convincing enough. It barely breached the IHS neckline at 927 but volume was only mediocre, not high enough to be a convincing breakout for IHS. Also index was stopped at the very strong resistance of 931. I am confident that the CI will reverse & correct down & possibly form a double shoulder. No IHS breakout yet. Also there is a Doji Evening Star in the CI Futures (see below), so a reversal & correction in both CI & CI Futures is most likely outcome.


There is a massive Doji Evening Start reversal formation in the CI Futures. It gapped up strongly by 6 points over Monday's close in forming the Doji & this makes the pattern more likely to happen. If it opens BELOW 924, then the possibility of a reversal is very likely. Support is at 905 level. I call a SELL on CI Futures here.

Tuesday, July 25, 2006

Watchlist: Johor Land Consolidation & Flag


Johore Land Bhd has been consolidating in a possible Flag pattern since reaching its recent high of 1.17, close to the highs of 2002 & 2004. Volume has fallen considerably to almost negligible amounts fulfilling the requirement of the Flag pattern. Current price of 0.955 is close to support levels of 0.92 - 0.90.

A breakout has a measuring level of 0.35 (to be added to the breakout price). If breakout on high volume happens at 0.92, the Target Price is 1.27 to 1.30 the next resistance level. Assuming that interest in SJER is still high, then this consolidation has the potential for strong breakout potential.

Cut Loss is below 0.90 BUT buy only on strong volume breakout out of the Flag & not before.

Monday, July 24, 2006

Palm Oil & Plantations Index

The plantations index is again rising and may continue to do so in the near future BUT it may need to take a short breather first.

Palm oil prices have risen to a 2-year high & Oil World is predicting higher prices. I quote from their site:
"Jun 30: Growing Risk of Global Production Deficits in 2006/07 and Weather Concern Is Likely to Lead to Higher Prices. Current stocks of oilseeds and oils at record level. But increasing risk of an excess of world demand over production in 2006/07, necessitating a reduction in stocks. Three years of unprecedented demand growth will finally create a situation in 2006/07 in which world consumption of 17 oils & fats and of 10 oilseeds will exceed production. In the medium term we expect higher prices for oilseeds and products. Most likely vegetable oils will be the price leader upward (i.e. palm oil being the biggest of the vegetable oils).
See http://www.oilworld.biz/app.php

So we will likely see higher palm oil prices this year which will be good for the plantation counters.

The index itself has reached a high last seen in 1994 which is now a strong resistance A-B). This may hold it back for a while & we will likely see a correction. The Inverted Head & Shoulder pattern has been confirmed with a breach at the 3333 level on high volume. For H&S a pullback is normal before continuing. Measurement target is 3639.