Talking Stock With The Doc

This Blog has been created for the purpose of sharing my ideas on investing on Bursa Malaysia using Technical Analysis. Stock market investing is a science & TA a scientific tool used by investment professionals. TA also has its sceptics but this is an oportunity for you to follow TA based investing ideas. So welcome to my blog and may you "Live Long And Prosper".

Saturday, July 15, 2006

What Next For MTDi, RHB, Utama, Tebrau & Versatile

Some of our favourite stocks took big tumbles so I will review them here.

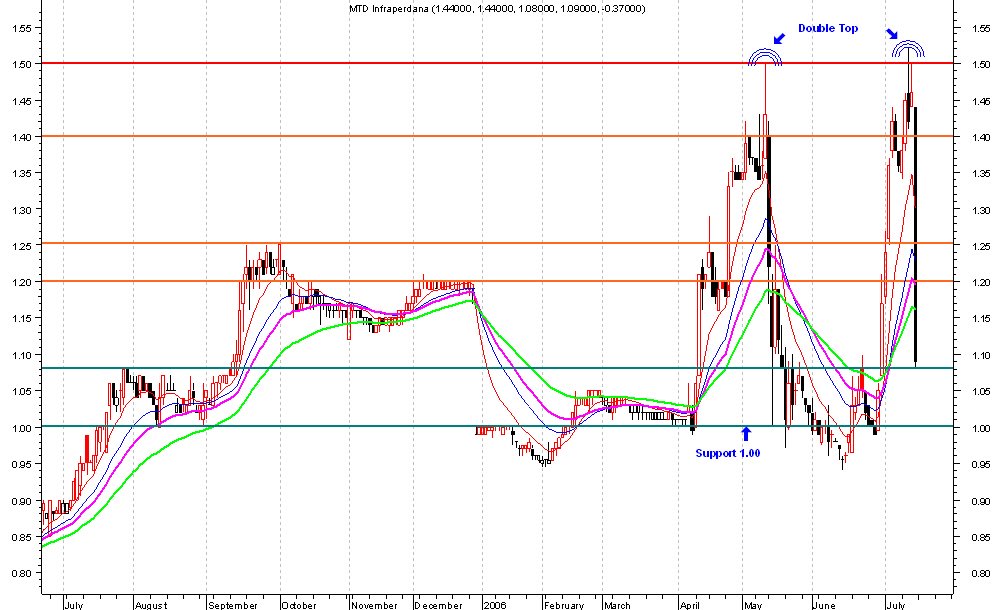
1) MTD Infra - took a big tumble. Cup & Handle & Flag both have failed dramatically. If you had followed my blog, I put a cut loss at 1.40. It found support at the long term support of 1.08. Further support is at 1.00. If you have not sold, then you may want to sell on rebounds. Resistance is at 1.20 & 1.25.


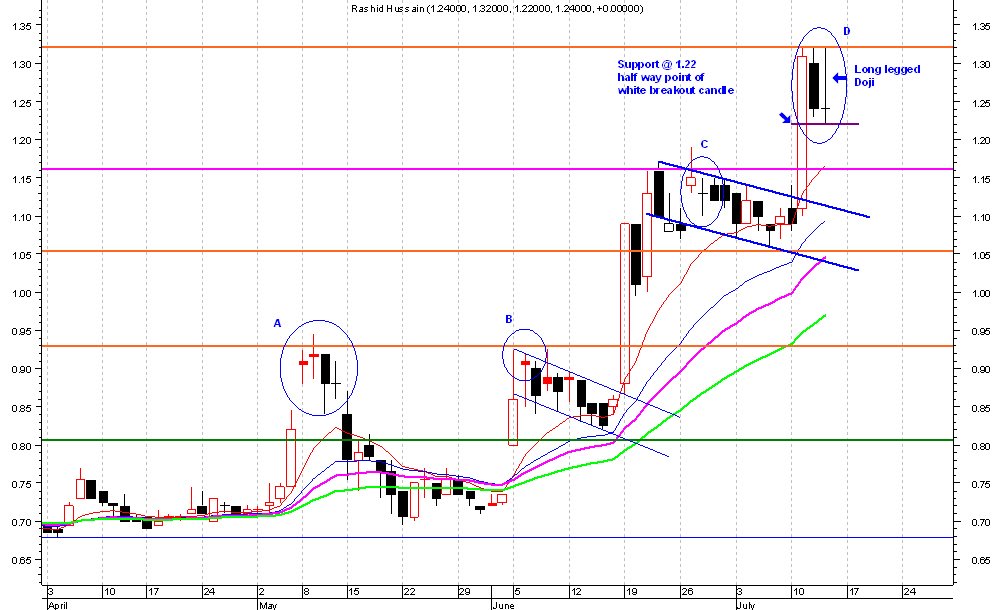
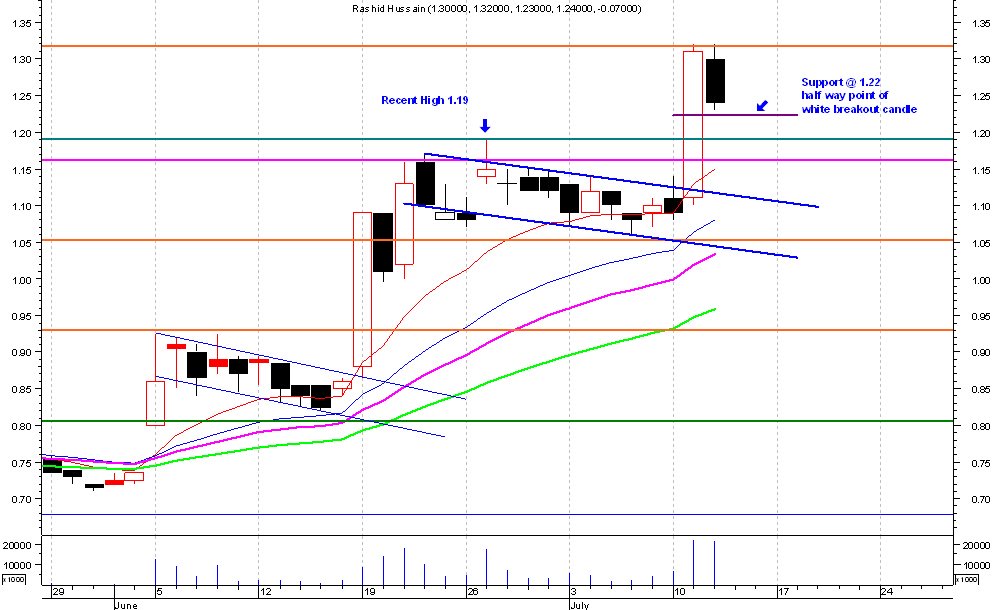
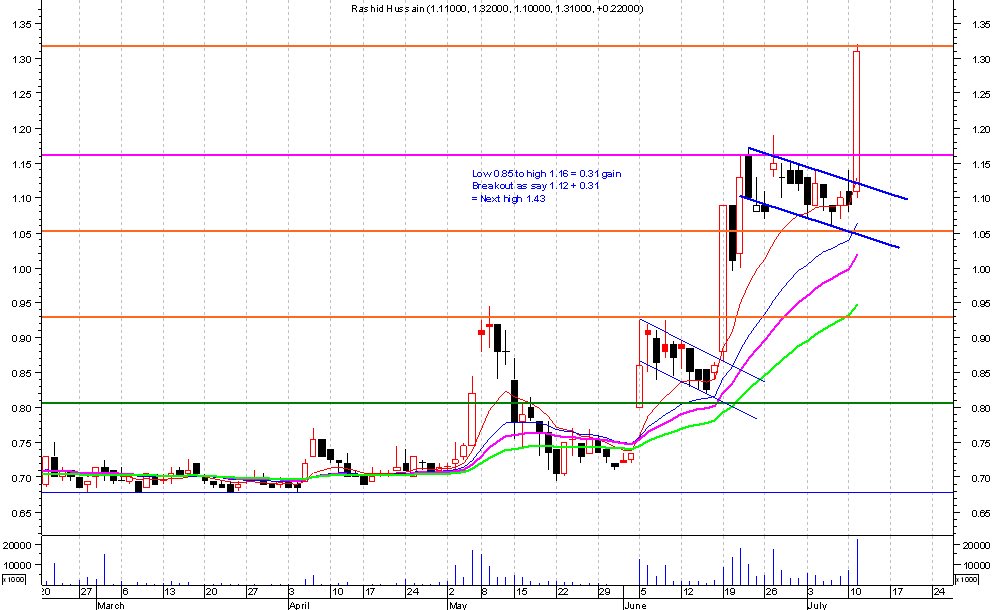
2) RHB held on at the support level of 1.16. Further support exists at 1.05 & 0.93. Due to the EPF buyout proposal, it should hold at 1.05.


3) Utama - This is a very good stock. Despite the falls elsewhere it held up close to the support level 0f 1.11 which was half way up the candle & also a long term support. Additional support is at A 1.08 the top of the flagpole & B 0.92 a long term support. Volume is low despite the fall. I would hold this stock.


4) Tebrau - It found support at the long term support of 0.55. Further support is at 0.45. I am still holding this stock & would buy again if it goes to 0.48 - 0.45, as I believe 0.45 is a strong support. However, unless the market continues to bleed, Tebrau migh hold at 0.55. It is surprising that earlier many people were so sure that it was a good stock & were prepared to buy at 0.72, but now everyone wants to sell at 0.55. This is the time to buy not sell.


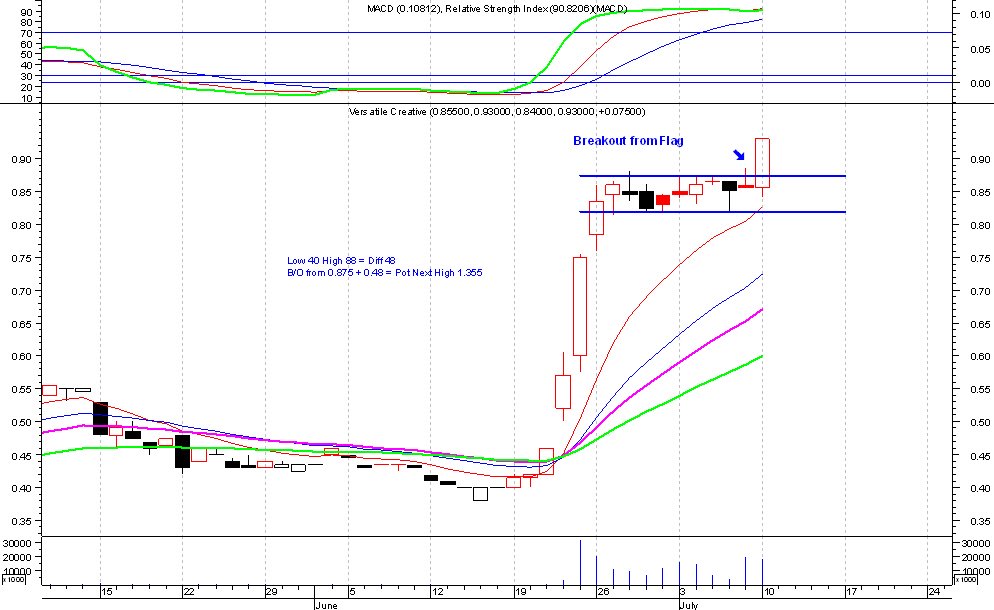
5) Versatile. The Flag has failed. However, if you had followed my posting a fall below 0.875 was your cut loss because that meant failure. It found support at a previous high of 0.65. Further support is at 0.55. Despite the fall, volume was not abnormally high at 17 mil as on 12 July it was at 23 mil. If you have not sold & can afford to let it fall to 0.55 before rising again, then you may want to hold on. It will probably rise again as all good syndicated stocks do... 8))

Incidentally the same applise to Iris.

KLCI Supports


Global stocks took a bashing on Friday ours just as badly. I suppose the signs were there:
1) Mounting tensions in Israel/Middle East
2) This lead to record high oil prices
3) Rising Interest Rates in Japan
4) Uncertain economic conditions in the US
5) Which lead to a 2 day fall of over 200 points in the Dow by Thursday & by Friday it was almost 400 points
6) CI was reaching a peak at the 930 level
7) Syndicated stocks like Iris, Oilcorp & others was being pushed up again.
8) Aunties & Uncles were starting to crowd trading floors of the brokerages

You would have noticed that unlike the Dow & CI prices, these are fundamental issues that affect markets, so traders need to sometimes look beyond TA to other factors as well.

So whats the outlook for the CI?

Supports for the CI are at 906, 900 and 883. The double bottom at 883 should be a very strong support for the CI, so in my mind the only question is whether the CI will breach 906 & 900 or will these hold? The key would be oil prices. If tensions continue to mount in the Mid-East & oil prices rise above US$80 a barrel, then even 900 will not hold. If prices don't rise any further then it just might hold. We cannot be certain at this stage.

If you are out of the market, then hold on to your cash until we see better signs. If you are in the market and can hold on, then do so until we know better.

In a market that plunges badly like this, prices may rise up in small technical corrections before falling again. If you cannot or don't want to hold, sell on rebounds & then pick up stocks when prices stabilise or when the above supports convincingly hold.

MTD Infra & Iris - Comments - Failure of Cup & Handle

Ichithe killer has posted comments on the Iris - Bullish Breakout posting I made on 13 July. He has some very pertinent comments which I encourage you all to read.
http://talkingstock.blogspot.com/2006/07/iris-bullish-breakout-possible.html

This is what I said to Ichi:
Thanks Ichi, your comments are welcome. Yes you are correct which is why I state that we have to be careful & I mention that traders have to sell if it falls below a certain level.
1) For MTDInf I mentioned that it had to have convincing breakout above 1.44 & traders must sell if it falls below 1.40 which happened.
2) For IRIS I stated that it had to rise convincingly above 1.38 for pattern to be valid. It did not rise above this.
TA is still an Art not a Science. Unfortunately our markets can also be easily manipulated & this does happen like you say.
I believe if we all share our comments & thoughts regularly we can all do much better. Keep your comments coming they are very welcome.

How to Spot Supports & Resistances


I have been asked how I spot supports & resistances for eg. why did I say in my last post that RHB had support at 1.16 (which is the level it closed at on 14 July despite the broader market falling badly). The attached chart of RHB shows the different S&R levels marked A to D.

A previous top will tend to be a resistance but once that resistance is comfortably breached, it now becomes a support when prices fall. The first support (A) lies at 1.15 to 1.16 and this is shown by A1 & A2, previous highs.

Additionally a previous bottom (i.e. where a fall was stopped) will continue to offer support again. So the second support of 1.05 is given by the 2 previous highs at B1 & B2 and also by one bottom support at B3.

The more highs & low supports there are when taken over a long period, the stronger will be the resistance & support levels. So level D at 0.80 has many bottom supports (i.e. falling prices were supported at this level D1, D2, D3, D4, D5 & D7) and also a resistance (i.e. rising prices were stopped at this level D6). Hence if prices are above 0.80 & falling, they will find support at 0.80. However, if prices were at say 0.70 and rising, the chances are that they will be stopped at 0.80 which will act as a strong resistance.

So RHB has found support at 1.16 (A level) on Friday 14 July, but if market sentiment remains very bad it might fall again but will find stronger support at B 1.05.

So should you sell or hold RHB? If you are comfortable holding the stock & have not bought on margin or contra, then it will be safe to hold as I believe 1.05 will be a strong support. However, if you cannot hold, then if 1.16 is breached, it would be better to sell & buy back if the stock finds support at 1.05.

Friday, July 14, 2006

RHB - Long Legged Doji - Reversal?


I have had a few requests to comment on the Long-Legged Doji that has formed in RHB. It is called LLD because of the extra long upper shadow. Normally Dojis point to a reversal in prices but in this case it came 2 days after the long white candle breakout from a Flag, therefore it is more difficult to call.

We can consider several options. Firstly, Dojis seem to be a common occurance in RHB. In May & June 2006 alone there were 3 Dojis that were temporary tops (A-C). Doji 'B' is not an exact Doji but it is close to one & can therefore be considered a Doji. Doji 'C' came within a sideways movement so it may not be significant as a reversal pattern.

Yesterday's Doji however does have significance because it came just 2 days after a very large white candle. The day after the white candle was a harami & now a Doji. This seems to indicate a reversal is a strong possibility.

As this does not give us a 100% signal we should look for other confirmation signs. An important point is that all 3 candles were stopped at the 1.32 level which is also a long term resistance. This is important and may signal that the bulls are unable to break this strong resistance. However, the half way point of the long white candle at 1.22 is still providing strong support even for the LLD.

RSI is only 67 (not overbought so no sell signal there), MACD is still positive & volume on the LLD day was lower that the previous 2 days.

A valid call would be for a correction to take place BUT I would wait for one more day before I make that call. If today prices open at or below 1.24 (yesterday's closing price) & fall (and close) below 1.22, then the LLD has signalled a reversal & prices will fall further. This might still only be a minor correction and not a major correction. Strong support is at 1.16.

As a precaution I would advise contra players to sell if prices fall below 1.22, but if not then hold on prices might just be flat before resuming the uptrend.

Thursday, July 13, 2006

KLCI - Mild Correction then Inverted Head & Shoulders?


There has been some discussion on ChargingBull's blog about KLCI and a possible inverted H&S formation. Lets see what the chart shows.

Firstly the double bottom formed on 2 Dec & 15 June is now confirmed (X & Y). This is bullish for the CI and has been reflected in the rise up to current levels. Secondly, it has risen convincingly above the 200-day Moving Average & is staying above it. Thirdly it is also above the long term uptrend line (Z1-Z2) which goes back to year 2003. It is also above the 10, 21, 30 & 50 day MAV. Daily RSI & MACD are positive. Weekly RSI is flat but weekly MACD has not shown a positive crossover yet (the only negative indicators so far).

Are we also seeing the possibility of an Inverted Head & Shoulders pattern forming? S1 is the first part of the shoulder, Y is the head. If prices over the next few days fall slightly to around 920 & then rise again, then the second shoulder S2 will be confirmed. There is a good chance of this if the Z1-Z2 trendline & 200-day MAV hold up prices. The question is will it?

If this scenario happens & a breakout from the H&S happens, the measurement target is 980 which is the top of the upper long term trendline (T1-T2). Everything will then fall into place very nicely for Charting enthusiasts.

The possible dangers to this is the record oil price currently at US$ 76 a barrel & the falling Dow. If oil rises beyond $80 & the Dow falls below 10,500 convincingly then the CI will also fall & all bets are off.

For now I believe the CI will stay strong, the next few days are important to determine the H&S formation.

IRIS - Bullish Breakout Possible + Versatile Update


Iris has been consolidating in a tight Flag since 3 July & broke out of the Flag on higher volume 0n 13 July. It closed at 1.37 just below its historical high of 1.38. Interestingly it has also formed a Cup & Handle pattern (A-D). Although the handle of a cup normally slopes downwards a flat handle is also possible. Looks more like a pan than a cup now.... 8)

Regardless, it is a very bullish pattern. A breach of 1.38 (the top of the cup and also the historical high) on high volume will be very bullish. RSI is still only 78 (bullish & not oversold) & MACD is positive. Weekly MACD has also recently turned positive.

I rate this a Strong BUY if there is a convincing volume & price breakout above 1.38

Concurrently, Versatile will also move up if there is a strong breakout in Iris. Versatile has been consolidating recently & has stayed above the Flag. So keep an eye out for Iris & Versatile.

Tebrau Update - BUY on breach of 0.725


Tebrau is undergoing very healthy consolidation. Obviously buyers are still keen on the stock. If it breaches the recent high of 0.725, then the bulls will start charging again. Upon breach of 0.725 on strong volume, Tebrau will be a strong BUY. Target price is 1.10.

Wednesday, July 12, 2006

Updates MTD Inf, Tebrau, RHB, Utama, Versatile

1) MTD Infra behaved in a very strange & uncomfortable way towards the close today when there was great selling pressure which took prices right down below the top of the cup at 1.44. It closed at 1.42 so still remains above the Flag breakout price of 1.40 so the Flag is still valid but the cup & handle breakout is uncertain. We need to see prices tomorrow.

Prices failing with high volume is disconcerting especially after a breakout. However, it is normal for a Flag breakout to return to the breakout price before resuming the uptrend. At this moment I would say that MTDi is at an undetermined state. We need to see what happens over the next few days. If prices fall & close back into the Flag at 1.38 then both C&H and Flag are not valid. Support is at 1.40. Traders beware, you may have to cut loss if this happens.


2) Tebrau - Healthy consolidation. Support of 0.615 is holding well, volume is lower on consolidation. All good signs. Breakout above 0.725 will bring the bulls back in. At this present trend buying is possible at 0.61 the new support, otherwise it may be better to wait for breakout above 0.725.


3) RHB - Correction after such a strong breakout is expected. Support rests at 1.22 which is half way point of the breakout white candle. It should resume its uptrend as long as it remains above 1.22. A fall below 1.19 the recent high will not be good.


4) Utama - Correction after such a strong breakout is expected. Support rests at 1.14 (prior years support level) and more importantly at 1.11 which is half way point of the breakout white candle. It should resume its uptrend as long as it remains above 1.11. A fall below 1.11 will not be good.

5) Versatile - Healthy consolidation. Strong support remains at 0.875

Tebrau: Healthy Consolidation


Tebrau fell slightly today. If you read my last post you would have taken some profit. It is consolidating and the volume is only 36% of yesterday's volume, so it is healthy. Next support is 0.615 & 0.55. Even if 0.615 does not hold, 0.55 should. If you are longer term investor hold the stock.

Versatile: Consolidation After Breakout


Versatile is consolidating after breaking out from the tight Flag pattern. Volume is still high, but price pullback is not too bad. But price must stay above 0.875 to maintain the breakout. If it does then it will move up again shortly. Its 'sister' share Iris also moved up but volume is low & the breakout from its Flag is not confirmed yet. If Iris moves up strongly, then Versatile will fly.

For now, wait for further confirmation for Versatile & if it stays above 0.875 for another 2 days then it will be a buy with TP of 1.35

Bullish Breakout: MTD Infra


Another one of my Watchlist stocks MTD Infraperdana broke out of the Flag pattern strongly on high volume. It also formed a cup & handle (see my last post on this http://talkingstock.blogspot.com/2006/07/watchlist-mtd-infra-bullish-formation.html )

There is confirmation of Flag and C&H breakout with high volume and breach of the recent peak of 1.44 which forms one side of the cup & also the top of the flag. I would have liked to see a longer consolidation & a longer handle for the cup, but that does not mean the breakout is invalid. Once it breaks out of the May high of 1.50, this stock will move up strongly.

Next resistances are: 1.70, 2.15, 2.55 & 3.00

TP is 1.85 based on the flagpole starting with the opening price on 29 June & closing high on 5 July.

If volume continues to be high tomorrow & prices move above 1.50, then this is a solid buy. I peg a TP of minimum 1.85 but it could go much higher & 2.15 is a good possibility.

Tuesday, July 11, 2006

Bullish Breakout: RHB & Utama


What a great breakout, right out of the Flag as predicted. Both RHB and Utama broke out of the week long Flag consolidation to post superb immediate gains of 20%. Excellent! . Volume was high even though the movement started only after 4.00 pm. Both stocks are linked to each other because of RHB Bank & the EPF buyout proposal.

Will this lead to prices going higher? The next resistances are:
RHB: 1.54, 1.93 & 2.50 ...... Utama: 1.28, 1.37, 1.69 & 2.00.

Based on the flagpole measurement the Target Prices are: RHB: 1.42 ...... Utama: 1.32

Hence the possible TP for the stocks are: RHB: 1.54 ....... Utama: 1.37

This is assuming prices are only stopped by the stocks' resistances. So upside is:
RHB: 0.23 .......Utama: 0.16

However since prices rose very strongly, there may be a pullback first before it goes for the target. Chasing the stocks now would be risky, buying on pullback would be the better strategy. Of course you should have bought on breakout from the Flag which in my last article was at RHB 1.14 & Utama 1.00.


Books For Technical Analysis

I have been asked to recommend some books for beginners in Technical Analysis (or charting as some prefer to call it). There are 3 excellent books for people who are serious about learning TA.


1) A good beginners book on traditional TA is:
Getting Started In Technical Analysis by Jack D. Schwager

This book gives you the basics on TA and helps you to understand what TA is all about.


2) The bible of TA and one of the best books ever written on TA is:
Technical Analysis of Stock Trends - 8th Edition by Robert D. Edwards & John Magee

This book was first published in 1948 and is as good today as it ever was. I use it all the time as a reference text. You will not find a better book on TA anywhere. Its been republished in the 8th Edition, so it shows you what a great book this is.


3) A simple and yet very good book on Candlestick charting is:
Japanese Candlestick Charting Techniques by Steve Nison

Its well presented and simple enough for the beginner to understand. A great book on CS charting that I use as a reference all the time.


I would recommend that you buy all these books if you are keen on serious TA. Read the reviews on Amazon as well.

Update: Tebrau - Take Some Profit


Tebrau looks like it may finally take a breather & correct its overbought position. On 10 July it formed a "Shooting Star" in its daily candlestick chart because the bulls tried to rally the stock to a high of 0.725 before it fell back to 0.645 giving it a mere 3 sen gain. While a shooting star is not a major trend reversal pattern (according to Nison, see posting on books), it CAN and often does portend a reversal especially when a stock has risen as much as Tebrau.

However the next day's candle is important. If it opens up and continues to rise, then the correction may be delayed. This can be seen in the red circle marked 'B' in the chart where a shooting star pattern on 9 May did not lead to an immediate fall. However the SS on 2 May (C)led to a short correction, then the rise continued.

So short term traders should take profit today if prices fall early on, while long term holders might just take profit on some stocks while holding on to some for the next rally.

I believe Tebrau will continue to rise again after a short correction. RSI is at 85, overbought territory but still with space to go up.

BUY: Versatile Flag Breakout


True to predictions Versatile broke out of its very tight Flag pattern resistance level of 0.875 on 10 July on relatively high volume and closed at its high. If it stays above 0.875 & volume continues to rise or stay high then the breakout is confirmed.

This leads to a BUY call on Versatile. Target Price is 1.35.

As Versatile's real value lies in its substantial interest in Iris Corp, I have also included the Iris chart for discussion. Iris is very close to its historical high of 1.38 (currently 1.33). On 22 June the 'designated stock' status was removed by Bursa and the stock jumped from 0.875 (on 21 June) to 1.08 (on 22 June). If we take this as the assumed flagpole then it is currently forming virtually a very tight Flag pattern similar to Versatile. If there is volume breakout at 1.33 & it breaks out of the high of 1.38 then both Iris & Versatile will move up strongly in tandem and may be market leaders in the next few days.

The question is whether Versatile leads or Iris, though it seems Versatile is doing so based on the breakout on 10 July.

Versatile is a buy with a cut loss if it goes below 0.875.

Sunday, July 09, 2006

Watchlist: Utama Banking Group - Bullish Flag


Utama Banking Group is forming a bullish Flag pattern in its daily chart. Prices first moved up on 19 June & then formed a tight, flat Flag bet 19 & 27 June. It then moved up very strongly with high volume on 27 June with a positive breakout from that first flag. This is mainly due to EPF's buyout proposal for Utama's 32% share in RHB which indirectly owns RHB Bank.

Following that breakout, it has started to consolidate on lower volume forming a new Flag. Lower volume on flag formation is confirmation of the Flag pattern formation. The measurement of the upside is the size of the flag pole beginning on 26 June (0.785) to the top of the pole on 29 June (1.08) giving a difference of 0.295. So when prices break out of the Flag, it should rise by at least 0.295. Assuming a breakout at 1.00, that will bring prices up to approx 1.295 which is close to its second resistance level of 1.28 in the long term chart above. It could possibly rise to 1.37. So Target Price is 1.28 or if buying is strong 1.37.

Gains can therefore reach between 28 & 37%.

However as always for a Flag, the important point is the breakout from the Flag accompanied by high volume as happened with the breakout on 27 June.

As the interest in Utama & RHB is still high with rumours of a foreign bank (Bank of Nova Scotia) joining EPF in its bid for RHB, chances are good that we will see a breakout soon.

Keep an eye on this stock & watch for a breakout from the flag.

Update on 2 BIG Winners - Tebrau & ILB

On 3 July I recommended 2 stocks Tebrau Teguh & ILB. Both are big winners.

When I recommended Tebrau it had just broken out of a Flag & the next day Tuesday it opened at 0.42. It closed Friday at 0.615 giving a gain of 0.195 or a massive 46% in just 4 days. If you had bought this stock well done & hold on to it because it has not given a sell signal yet.

ILB had also broken a very strong resistance at 2.00 & it opened at 2.10 on Tuesday & closed at 2.30 on Friday giving a gain of 0.20 or 9.5% in 4 days. Not as good as Tebrau but still a very solid gain. Hang on to it as it still has not given a sell signal either. If you had bought the warrant, it opened at 0.945 on Tuesday & closed at 1.17 on Friday giving a gain of 22.5 sen or 24%, pretty good for 4 days trade. Like the mother share hold on to this one too.

Including Time, I made 3 recommendations & we had 3 winners. Not bad at all. Lets see if RHB, Versatile & MTD Infra are just as good, though they should only be bought on the breakout as recommended.

Watchlist: Update on Versatile & RHB


Both Versatile & RHB still have valid bullish patterns but are now Flags & not Pennants. However, both patterns have similar bullish characteristics so there is no change in the recommendations.

For Versatile, it is now a small & tight Flag (See chart 1). It still needs to break above 0.875 convincingly for prices to turn bullish, but if it breaks below 0.82 then it may turn bearish. If you have bought on Friday when it made a false move to break out, then hold on tight but you may want to sell if it falls below 0.82. On breakout Target Price is 1.35

RHB has formed a nice Flag (Chart 2). All recommendations are still valid & there is strong support at 1.05. Wait for volume breakout above 1.12 (with a close above 1.12) before buying. On breakout Target Price is 1.43 & if buying is strong 1.52.

Watchlist: MTD Infra Bullish Formation Flag and Cup & Handle


MTD Infraperdana (MTDI) rose very strongly from a low of 0.995 on 29 Jun to a high of 1.44 on 5 July giving a gain of 0.445 or almost 45% in just 5 trading days. It has since corrected for the last 2 trading days at the strong resistance of 1.40 - 1.44 which also stopped the rise of the stock in 2001, 2002, 2003 and also very recently in May 2006. It will take some effort to clear this resistance but if it does then the next targets are 1.70, 2.15 and 2.55.

The good news is that there are now 2 potential bullish patterns forming which may enable it to breach the 1.44 resistance & to hit the above targets - a Flag and better still a "Cup & Handle" formation.

Flag - It is still very early in the formation stage and it may take anything from 1 to 3 weeks before the formation is complete. Volume is also faling, providing early confirmation for a Flag (D1 - E1 and D2 - E2). A breakout from the Flag will have a measurement gain of at least 45 sen from point of breakout.

The second formation is the C&H. The cup is marked as D3-X-Y-D2 (note: I am using lines to mark the cup as Metastock does not allow me to draw a circular cup, but you get the idea). The handle is the Flag (D1-E1 & D2 - E2). As required of the pattern the volume also falls significantly in the formation of the cup bottom (X -Y) & rises when it forms the side of the cup (Y-D2).

It is a very bullish pattern and if it breaks above the prior peak of 1.44 it can rise all the way up to 2.55.

To read more about the C&H check out this link http://www.investors.com/learn/b10b.asp

So keep an eye on this stock. The C&H formation in MTDI is classic and almost perfect. One does not always find such a perfect formation in the charts. It is very bullish and once there is a breakout from the Flag and prices rise above 1.44 it will be a very strong BUY.

Caution: Buy only when there is a high volume breakout from the Flag and not before.