Talking Stock With The Doc

This Blog has been created for the purpose of sharing my ideas on investing on Bursa Malaysia using Technical Analysis. Stock market investing is a science & TA a scientific tool used by investment professionals. TA also has its sceptics but this is an oportunity for you to follow TA based investing ideas. So welcome to my blog and may you "Live Long And Prosper".

Thursday, September 07, 2006

How To Trade In a Down Market?

Basically - You Don't. There is no rule that we have to trade all the time & that we have to rush into buying some stocks just because it may have fallen to what looks like cheap prices. Never be tempted into buying simply because prices have fallen considerably. Buying when prices are falling is like sticking your neck out under a falling sword, you'll get it chopped off.

When you buy at this time you are hoping & assuming that the fall will stop & suddenly prices will rise again & you will make a ton of money! If you have read that anywhere then thats a load of rubbish. When you assume - you just make an "ass of u n me". Never assume, hope, guess or pray that you are lucky. Doing any of these means you are gambling & thats neither using fundamental nor technical analysis. Its just luck & trust me in the market the only luck you ever get is bad luck.

Be patient. If you have to stop trading stocks for a week or two or more, don't worry. You don't have to trade all the time. In fact the wise trader is the most patient trader. Wait until the fallout is over & when you see a strong technical signal then go in. If that means a 2, 3 or 4 week wait, so be it.

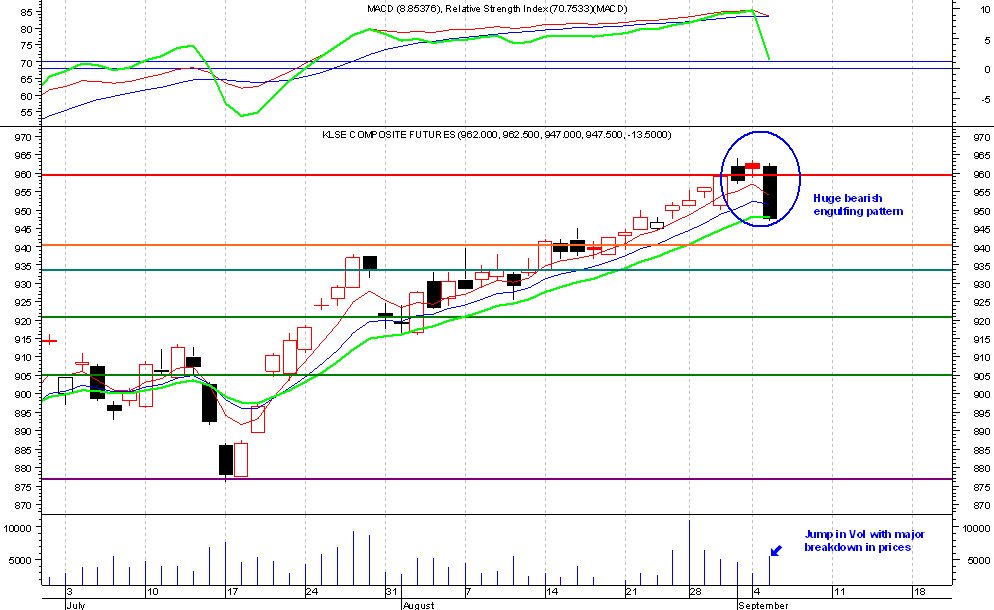
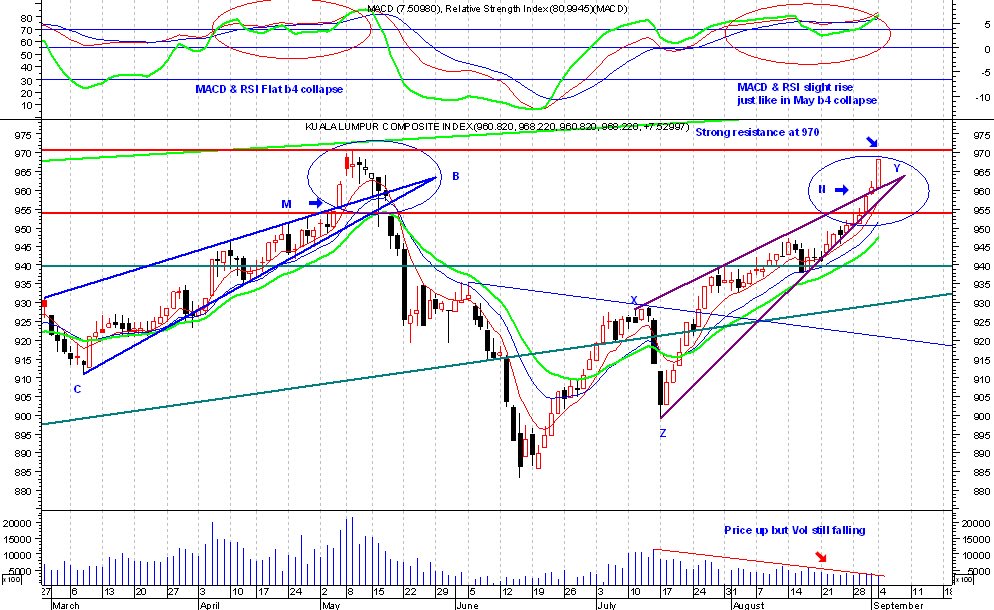
What are buying signals? Look for candlesticks like morning stars, hammers, piercing & bullish engulfing candles at support levels. When these form at support levels then it is a stronger signal. If this is coupled with supports at long term Moving Averages like the 50, 100 or 200 day MAV, then it is further confirmation that the bearishness may be at an end & a new trend may be starting. Also look for positive candles & signals in the weekly charts, they are excellent for changes in trend.

The key to making money is patience & a plan. That plan is a good TA plan. But patience....well only you know if you can be patient. If you want to win then patience is a virtue!

KLCI & Futures: Breakdown from Rising Wedge

KLCI- Yesterday (Wed) prices broke down from the Rising Wedge (RW) in a big way confirming the top reversal pattern. However, despite the big falls Vol has not been very high. But note that for bearish moves, volumes do not have to be very high, as prices can breakdown very fast because there are basically no buyers. The first initial support is 953. We may see a technical rebound at this point but because the market is weak the rebound will most likely be small & only a temporary delay of the inevitable further fall towards 940 & 921. Whether it falls further to 900 or 883 remains to be seen. Regardless the trend in the CI is weak with further downside likely.


FKLI - Futures had a big drop on Tuesday & some stability today. The discount to the CI is only 8 points now. Daily MACD has made a bearish cross & RSI has fallen, indicating a weakening market. If the CI stabilises temporarily today, so might the Futures. At this moment there is a bearish slant to the market & we definitely cannot state that this is the end of the correction. The likelyhood is that bigger corrections are in store & this is just a temporary respite. Strong support at 940 & 921.

Wednesday, September 06, 2006

SJER Theme - Loss of Interest?

Stocks based on the South Johor Economic Region theme seem to be among the biggest fallers this week. Yesterday Tebrau & UEM World took big tumbles.

Tebrau - took a BIG fall yesterday. There has always been a Descending Triangle (A-B-C) & that generally is a weak pattern with which we must be extra careful. The cutloss for the DT was 0.50 which I have stated many times in this blog. Anyone who has read my blog should have sold once it fell below 0.50 & if you did that yesterday you would only have lost 1-2 sen not the massive 12 sen or 23% drop. Weekly MACD has made a bearish cross down so this is not good for Tebrau. This is a major breakdown but there is support at 0.33, 0.28, 0.23 & a very strong support at 0.20. Actually 0.33 & 0.28 are also strong supports but panic sellers may dump & force prices below these supports.


Mulpha - also took a tumble & has a bearish engulfing pattern at a top. Weekly MACD has been negative for a few weeks. Vol has however been low despite the fall. Still the bearish engulfing candle indicates further falls.


UEM World - should by all accounts hold up quite well as fundamentally it has a lot going for it incl. the award of the 2nd Penang Bridge, huge landbank in Johor & as a major construction Co owned by Khazanah it will definitely benefit from the Govt's construction pump priming in Budget 2007 & also 9th Msia Plan. But technically it is weak, so we may see further falls yet. Two large black candles Mon & Tues, very negative weekly MACD & RSI, falling below the 7,14 & 21-day MAV all show the weak technical picture of UEMW. Only consolation is low volumes during the drops so maybe the institutions are still holding this stock. Support is at 1.25, 1.07 & 0.90. General direction is bearish & down. Don't re-enter until we see positive candlestick pattern.

Bearish KLCI & CI Futures

So the prediction that I have been making for the last week or so about an impending reversal in the CI & Futures has finally come to pass. In fact on Monday I said very clearly that we may see a major correction in both the CI & Futures on Tuesday & here it is. Everything I said about this situation has been based almost purely on TA. We even saw the Rising Wedge & I even quoted what Edwards & Magee said about the RW & its reversal potential. TA has clearly shown its strength, how can anyone even doubt the validity of TA now?

KLCI - saw a major top reversal at a strong resistance with the appearance of a dark cloud cover pattern (a large black candle that closes more than 50% into the prior day's large white candle). When this black candle appears after a large white candle esp at a resistance line this shows the bulls could not take take control of the market & have given up. The next move should also be down. When this is coupled with the rising wedge, if prices close below 959 (the Z-Y line of the RW) then it will be a major breakdown. Expect the fall to be fast & furious. Futures is at a discount of 14 pts to the CI so there is still some catching up for the CI to do (to the downside). Initial support is at 953 (weak) & 940. Strong support is at 921 & 900. Again I would not like to predict where the correction will stop, for that I will watch the candlesticks for a bottom reversal. But for now wise traders would STAY OUT of the market.


CI Futures - FKLI - also saw a major reversal today (Tuesday). It was the biggest drop for 3 months & is now trending 16 points below the CI, perhaps an ominous sign that the CI is due for a bigger correction in the next few days. It has formed a bearish engulfing pattern (large black candlestick, almost "engulfing" the prior day's candle) on higher volume, so it is clearly bearish. The weekly is also showing a major bearish engulfing pattern. Although we should ideally wait for a complete week to call the pattern for the weekly candle, I have no doubt that it will be bearish for this week. Supports are at 940, 933 & stronger support at 921. Below that we have support at 905 & 876 which will be very strong. We cannot predict where the correction will stop, we just have to watch the candlesticks for the downside reversal. The only way to trade the futures is to short it until we see a reversal.

Tuesday, September 05, 2006

Euphoria but what next for CI & Futures?

As expected Monday's Euphoric response to the budget came true. BUT risers & losers were about equal & volumes were very very low - not very convincing for whats supposed to be a 6 month high for the Index is it? So whats next?

1) KLCI - is getting close to its 970 strong resistance line. Volumes are low & there have been equal numbers of losers & gainers the last week including Monday. I am not at all convinced that the market can make new highs this week. Why?
a) The rise has been very steep without much of a correction to correct the overbought conditions. The steeper the rise, the harder the fall.
b) If the market is really bullish there should be much higher volumes but they have actually been falling while the index has been making new highs. This divergence is very disturbing & so not at all bullish. Even Euphoric Monday had very low volumes.
c) Even though the index is rising steeply there are as many losers as risers among stocks, not exactly a bullish market is it?
d) Technically the appearance of a wedge indicates a weakening market. The same thing happened in May & the market true to TA fell. Why should this time be any different? A breakdown from a wedge will be fast & furious.
e) RSI & MACD have been flat even when the index has been rising, another divergence that is not very comforting.
f) 970 has been a support/resistance line on many occassions before & in May stopped out the rise. Because the market did not correct adequately along the way it does not have the strength to rise strongly to break 970. From 18 July to 4 Sept (1.5 months) it rose from 900 to 968 with only one real correction (for 2 days) on 15 & 16 Aug. This is inadequate to correct the overbough position. So the market has no real strength.
g) Finally FKLI (CI Futures) did not rise on Monday & is at a discount to the cash market. Another strong indicator that the CI may correct.

When we take all these indicators into consideration the only conclusion is that the market is on its last legs. It will reverse very very soon, on that you can be sure.


2) CI Futures - is at a 7 pts discount to the CI. On Monday it did not follow the bullish CI trend & instead rose only 3 points compared to the cash market's 8. It is at the 960 resistance line & may soon fall. Vol also has been very low & falling despite the index rising. When we see such divergences in TA it is an indication of weakness & that the rise does not have strong market support. Maybe local institutions were holding it up for the budget. In any case Futures may also reverse soon, maybe even today. Initial support is at 940.