Talking Stock With The Doc

This Blog has been created for the purpose of sharing my ideas on investing on Bursa Malaysia using Technical Analysis. Stock market investing is a science & TA a scientific tool used by investment professionals. TA also has its sceptics but this is an oportunity for you to follow TA based investing ideas. So welcome to my blog and may you "Live Long And Prosper".

Friday, June 16, 2006

Double Bottom?


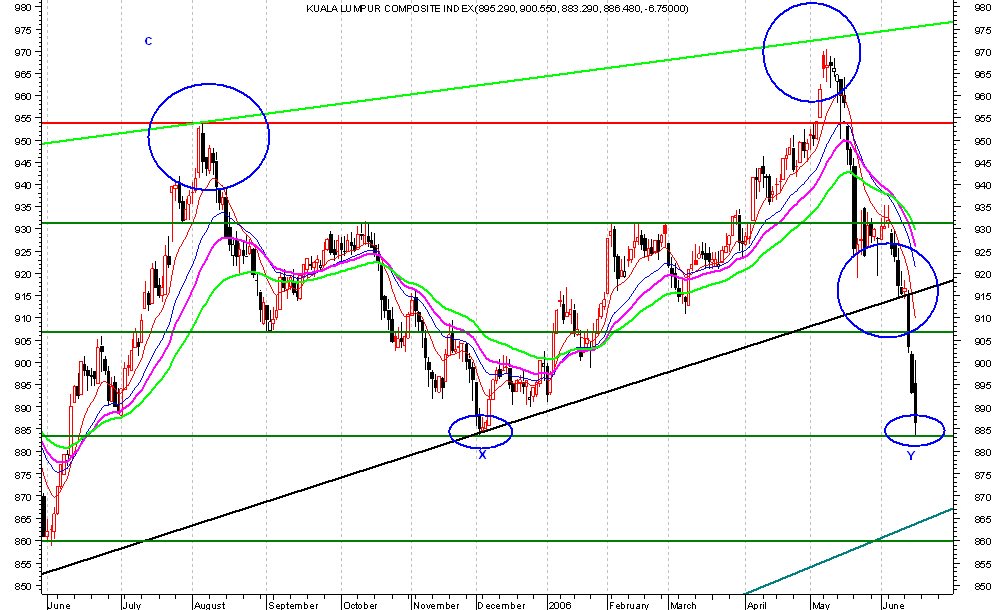
Last Monday (12 June) I posted an article stating that there was possible support at the 915 level which was the lower trendline of a rising trend channel from July 2003 but I also stated that the Dow would dictate whether further correction was possible. It was & subsequently the CI fell further. On 14 June I then posted a statement on Chargingbull's blog http://www.thechargingbull.net that there was strong support at the 883 level which was a double bottom but if this was breached then 860 would definitely hold. True to TA, the CI fell to 883 & found its support there on 15 June & the Dow's 2 day uptrend on 14 & 15 June has given the Msian bulls enough strength to rise from the 883 level. This will constitute a very strong double bottom & the market should start to rise again from here.
Also the strengthening of the Ringgit in tandem with the Yuan will bring foreign investors back in. Asian & European markets have also risen in the last 2 days & the CI will now play catch up.
If the CI stays up for 3 days, then I will say that this is a confirmed double bottom & the bulls will take charge again. See chart for the 883 double bottom marked 'X' and 'Y'

Monday, June 12, 2006

KLCI as at 9-6-2006 - Bullish Change in Trend?

The recent correction in the KLCI was predictable as it had reached the top of the long term trendline of tops from March 2004 to May 2006. Chart 1 below shows the 4 tops from A to D. At 'D' the correction was additionally confirmed with a weekly hanging man candlestick. Now the index has reached the bottom of the trendline which stretches from July 2003 to June 2006 and which was formed with 6 bottoms in the markets (Chart 2). This is a very strong support for the CI. Also there is an 'inverted hammer' pattern formed on Friday suggesting a bullish change in trend. If the market opens above 915.5 on Monday, then the bullish change is confirmed. This suggests that this is the bottom of the market in this correction & the bull should resume its uptrend. However, external markets especially the Dow may dictate the KLCI trend, so that is the only catch to this TA analysis.


Talking Stock Objectives

This Blog has been created for the purpose of sharing my ideas on investing on Bursa Malaysia using Technical Analysis. Stock market investing is a science & TA is a scientific tool used by investment professionals. TA has its sceptics but this is an oportunity for you to follow TA based investing ideas and decide whether it has any merit as an investment strategy. So welcome to my blog and may you "Live Long And Prosper".

Important Disclaimer

Disclaimer: This Blog is for the purpose of sharing investment ideas on Bursa Malaysia using Technical Analysis, solely for information only & should not be construed as an offer or solicitation for trading, purchase or sale of the securities mentioned herein. No warranty is given & no liability accepted for any loss arising whether directly or indirectly as a result of the reader acting on such information or opinion. The reader must at all times seek independent advice before trading in any of the securities mentioned. Caveat Emptor.