Talking Stock With The Doc

This Blog has been created for the purpose of sharing my ideas on investing on Bursa Malaysia using Technical Analysis. Stock market investing is a science & TA a scientific tool used by investment professionals. TA also has its sceptics but this is an oportunity for you to follow TA based investing ideas. So welcome to my blog and may you "Live Long And Prosper".

Friday, July 21, 2006

Update KLCI & Futures

KLCI closed up at its high again this week despite regional markets falling. However, it still has not breached the neckline of the IHS formation which is at around 927. The biggest concern is that despite rising index, volume is actually falling (see chart). Thats a bad sign. Daily MACD & RSI are still rather flat while the weekly are still negative.

I will throw my hat in the ring and call for a CORRECTION in the CI this coming week. If prices fail to hold above 924 or rise above 927 then it should fall to 913 or even 906. If after the fall it then rises we may see the true unfolding of the 2-shoulder IHS & then a big rise in the index. So I would be quite cautious this week.


FKLI (CI Futures) have been trending up this week but is there a correction coming? The weekly chart shows strong resistance at the 921 level at several points in the chart since 2004. That level has stopped the FKLI at least 5 times will it do so again? Considering that the CI itself may correct down I believe that 921 will again stop the FKLI this week. Also the weekly MACD & RSI are still down but coming to a flat position while the Daily have just turned up with a golden cross in MACD. However the over whelming indication is for a correction. So if you are still bullish on Futures tread with caution.

Watchlist: Plantation Stocks - IJM Plant & Kulim

These are two interesting & lower priced plantation stocks that may interest traders.

1) IJM Plantations has been trending up since March & is close to its peak of 1.62. Daily & weekly MACD have made a golden cross & daily RSI is only at 62 & rising. Friday's volume is also the highest in 2 months. It is also trending above the 10, 21, 30 & 50-day Moving Averages. Looks like a good stock to buy. If the Plantation Index IHS comes true then this should also run up quite nicely. Stop loss is at 1.39.


2) Kulim has formed a nice uptrend channel since 2001. However everytime it hits the top channel line there is a major correction. It just hit that line again this Friday as seen in the weekly chart attached. Also while prices rose strongly this week they were NOT accompanied by high volume. The daily volume on Friday when prices gapped up & hit the peak were actually very low. Higher prices but lower volumes is a divergence of some concern.

Also Weekly RSI at 94 is oversold & MACD is positive. Daily RSI is 66 & just turned up, daily MACD is positive. Resistances are at 3.85, 4.24 & the all time peak of 5.20.

However the bullish momentum in plantation counters should just push Kulim above the channel at least in the short term towards 4.24. Whether it remains there is another matter so buyers have to keep an eye on this if they buy. But being one of the cheaper plantation stocks no doubt it will see a lot of interest next week.

Plantation Stocks - Next Bull Run & IHS in Index?

Interest is building up in plantation stocks with the run up in crude palm oil prices. On Friday 21 July plantation stocks were the market leaders.

Interestingly there appears to be a very bullish Inverted Head & Shoulders pattern forming in the KL Plantations Index (PI) which is at a level last seen in Sept 1994, the next high being the all time high of 5 Jan 1994 (the super bull run, when CI peaked at 1332). The PI closed right on the neckline of the IHS at 3406, and close to the Sept high of 3443. It looks like the bullish momentum is there & no doubt the newspapers this weekend will spotlight palm oil & thus bring in the hordes of punters buying plantation stocks next week.

If it breaks out on high volume the IHS measurement target is 3834, close to the all time high. All that we need is a high volume breakout. But remember, in 50% of IHS breakout, prices will pull back to the neckline before resuming the uptrend so watch out for possible selling to emerge after breakout to shake out all the punters before it rises to the all time high.

Readers' Articles

As requested by my readers I have created a spot where you can post articles of relevance & interest here. All you have to do is email me the article either with your name or pseudonym and a contact email (optional) & if it is ok I will publish it.

However, if it is not your article then I will need the consent of the writer or publisher before I publish it. This is to ensure that copyrights are protected. Alternatively, you can write a brief of the article & provide a link to the article, thats fine too.

So lets get this going..... 8)

Thursday, July 20, 2006

Taliworks Cup & Handle

The ChargingBull & Pitbull have been discussing the possible formation of a Cup & Handle in Taliworks & they are right, it looks like a very nice formation. The handle is tapering down but prices remain above the half way point of the cup (1.56). Volume is also low, which is preferable at this stage. As CB says this is possibly accumulation by players.

Daily MACD & RSI are tapering down but both their weekly are up. This is to be expected as volume on daily accumulation is low & daily prices are falling slowly. This pattern will breakdown if prices fall below 1.56. Players can accumulate at this stage but risk averse players should wait for breakout above the 1.80 level for confirmation. Cut loss will be 1.55 (thats about 10% below today's price).

CI Update & Double Shoulder IHS for KLCI?

The CI did not penetrate the long term uptrend line again despite regional markets flying. This shows lack of conviction of market players despite lower than expected inflation, probably no rise in interest rates in M'sia & 9MP announcements. If CI does not take out the 922 level convincingly then it will probably correct again to 906 or 900 before making another attempt.

This throws up an interesting possibility of a double shouldered Inverted Head & Shoulders pattern (see Chart). It is just as powerful a pattern as the one shoulder IHS. For the breakout to occur it still has to cross the trendline possibly at 'Z' around 925. On high volume that would rate a strong buy. For now unless there is breakout above 922 soon, I believe the market will correct itself first. Today's candle & volume is not very convincing, so I believe a correction will be the next action.

Buy When Nobody Wants to Buy - Refresher

It appears that this strategy was not exactly clear to some of my readers. So when is the time to buy?

Firstly do NOT buy when prices are falling like Iris did yesterday. Like someone said, that is like trying to catch a falling sword, it will cut you in half. No, thats not the time to buy.

The time to buy is AFTER the selling has been done & the stock enters a "quiet" period, i.e. low volume, prices do not fall too much (small fall is ok) & you do not see many sellers waiting to unload. As an example, the time to buy in MTD Inf & Iris is shown in red and times NOT to buy in blue. I have used stocks that have taken big falls because this strategy is the only strategy to use in these highly volatile stocks.

I believe this should clarify this strategy.


The Dow, US Economy & KLCI

Dow Jones moved up strongly today to recapture the 11,000 points level. While this is a positive move coming on several days of downward pressure, it is based three factors.
1) The most important seems to be the market's perception that the Fed may stop raising interest rates. According to CNN: The Fed expects economic growth to slow this year and next, which "should help to limit inflation pressures over time," Bernanke said in testimony to the Senate Banking Committee. This is of course good news for interest rates & lower inflation is good for the economy too but if US growth slows down too much then world growth too may slow down too much.
2) The second factor is that US companies are reporting good earnings in the double digits. So a slowing economy is not slowing down corporate profit growth. Hmmm, so far so good.
3) Oil prices have fallen from the $78+ to just about $72. OPEC has stated that high prices will be bad for the world economy & that a slow global economy is bad for oil producers as demand will slow. So keep pumping it up boys. Nothing new here, but markets like this. Also US oil reserves have gone up despite it being the summer driving season when oil demand is highest. Maybe those blokes in the US are actually driving less? No they are driving more, just about 3% more, but nevermindlah, thats not too bad, could have been worse.

Anyway how will this affect Bursa? For one Asian markets will definitely rise. The triple whammy of lower inflation, stop in interest rate rises & lower oil will help. So Bursa should rise too. Now if this triple whammy maintains for the long term then we will see a rally on the markets incl. Bursa. That may provide the Inverted Head & Shoulders I spoke of in an earlier posting & a rally to 976. http://talkingstock.blogspot.com/2006/07/kl-futures-ci-ci-head-shoulders.html

However, first the CI must return above the uptrend channel & breakout above 922 & maintain above that. Then it must take out the very strong 930 level. Only then will we see the rally to 980. Chances of this happening? I am not into crystal ball gazing, so I will let the charts do the talking & if the above targets are met then its "Game On". If not then back to a mild correction again.

Last Update: Iris & Versatile

This will be the last update on Iris & Versatile. Thats because these syndicated stocks are so heavily manipulated they are not easy to trade & because of this, TA may not have much value. Also I don't want to encourage trading in such stocks, as losses can be too great. The risk-reward ratio is not worth the trouble. So unless some very interesting Technicals form, I will not bother with these 2 stocks in my posts.

Iris - The fall today was below that of Monday. It is resting on the 1.00 support but selling was intense & volume very high. Next meaningful support is at 0.72. Daily & Weekly MACD & RSI are negative. The recent high also forms a Double Top. I would stay out of this stock unless you want to have a heart attack.


Versatile - Has also fallen below Monday's close. This stock tracks Iris because it is a substantial shareholder in Iris. Daily MACD & RSI negative. Weekly MACD is still positive but may not remain so for long. Weekly RSI is down. Next support is 0.55. I would also stay out of this stock.

Wednesday, July 19, 2006

Update KLCI, Tebrau, RHB, Utama

1) KLCI - While movement has been positive since coming off the 900 low on Monday, volume has not been great, Daily MACD & RSI are still trending down (despite index moving up, thus a divergence, which is not a good sign). The 10, 21, 30 & 50-day Moving Averages still not in uptrend yet (X), so we still cannot say the CI is positive. There is very strong resistance at the long term uptrend channel A-B. Index has to break strongly above 922 to move positively into this channel. While I don't want to appear too negative, I think this short term rise will be capped at this level & CI might trend down again but good support is at 900. I would hold off buying till indicators turn more positive.


2) Tebrau - has formed a downtrend channel (A-B, C-D). It will only turn positive if it can break out of this channel with high volume (i.e. above 0.66). Until then the trend is down. Supports at 0.55 & 0.45. Break below 0.45 should be viewed very negatively though its unlikely to happen. RSI is down, Daily MACD trending down tho still positive. It is resting on the 10-day MA, but the 21-day MA should offer better support. Outlook is therefore for a short term downtrend from here.


3) RHB - Seems to be going nowhere. The trend is flat because volume is drying up. Support is at 1.16 & 1.05. Daily MACD negative & RSI is down. Chances are it will fall below 1.16 & find support at 1.05, but don't sell unless this happens. Don't buy either until a better signal is seen.


4) Utama - is trending flat to down. Though the candle looks like a bearish engulfing it is not. An engulfing candle only has real significance at a top or bottom to show a reversal. However the black candle coupled with Daily MACD & RSI trending down and the fact that it has slid below the flagpole top is not so good for Utama. If 1.07 holds & it goes above 1.08, then it is ok. But if not then look for support at 1.00. It is also right on the 10-day Moving Average, but this is not a strong support. The 21-day support at 1.00 is a better support. If it falls below 1.00 then it will turn very bearish with next support at 0.80 - 0.82.

Update: KLCI, Iris/Versatile, RHB, Utama,Tebrau, FKLI

1) KLCI - Should still be ok, with support at 906 & resistance at 913. It needs to break above 913 for next significant move to 920 & 930. Dow closed up & Oil down, so CI would be ok today.


2) Iris - Has made up half of the loss from the large black candle last Friday. If volume buying continues, prices may continue to rise. Resistance is at 1.24. Once a syndicated stock always a syndicated stock. Trust me this stock will beat all expectations & make new historical highs this year. BTW Versatile will also follow Iris & continue its rise from the major correction on Friday.


3) RHB - The candle that looks like a shooting star isn't one at all. Shooting Stars are top reversal patterns. This candle is not at the top, so it is not significant. RHB can go anywhere at the moment but more likely will be flat for a few days. Support at 1.16 & Resistance at 1.32.


4) Utama - Has formed a Doji Evening Star, a reversal pattern to confirm correction is over. However, I would have liked to see 3rd white candle close higher into the 1st black candle (see 3 candles in the red circle). The strength of the reversal is not high bec of low volume. While it should not fall below 1.08, it will need vol to breakout of recent high of 1.23. Good chance it will go flat for a few days to gather strength for a breakout action. A fall below 1.08 will be negative.

5) Tebrau - is trending up nicely. Breakout above 0.645 (out of short term downtrend) is positive & vol breakout above 0.725 will be very bullish. Daily & Weekly MACD has remained positive even thru the recent major correction & RSI is only 68 & moving up. All good signs for Tebrau. BUY with cut loss below 0.55.


6) CI Futures (FKLI)
Candles show bullish Engulfing pattern at the recent lows. Based on candlestick, this is a definite bullish pattern, next move will be up for FKLI.

Tuesday, July 18, 2006

Idaman - Morning Star


At the request of ty2ls & T5 (my readers) I am posting Idaman's chart & analysis.

It has indeed formed a morning star candlestick pattern today, which is generally bullish & confirms the end of the correction. The 3 candle pattern (circled in red) started with the long black candle on 14 July, the short white candle (17 July) that is below the black candle & finally the strong, bullish white candle on 18 July which opened above the 2nd small white candle & closed right above the first black candle.

I have also posted the 1 year charts for targets. The next target is 0.28 (very strong resistance) and beyond that 0.34. Anyone buying this for short trades should cut loss at 0.23 the opening price of the long white candle.

Good spot ty2ls, good analysis T5 ... 8))

Monday, July 17, 2006

Update: Utama, Tebrau, IJM-W, Versatile, RHB, MTD Infra

1) Utama
Has formed a very nice Doji which opened & closed at the recent high of the Flagpole 1.08. If the price opens above 1.08 tomorrow, then the correction is over & prices should rise from here. This Doji after a downtrend is a bullish sign.


2) Tebrau
For followers of Candlesticks, today's pattern is NOT a piercing pattern which is a bullish bottom reversal pattern. For a piercing pattern the candle must push beyond the half way mark of the prior black candle i.e. 0.60 but in this case it closed at 0.58. The pattern is a "Thrusting" pattern & is sometimes viewed as a bearish pattern in a downtrend. However, since Tebrau is still on a higher high (i.e. this high is higher than the high of 11 May) one could say that it is not in a downtrend but its just a minor correction in an uptrend. In this case the thrusting pattern is viewed as bullish. Hence if tomorrow Tebrau opens above 0.58, then the trend will be up & today's candle is a bottom reversal of the minor correction.


3) IJM-WB
This stock has formed a beautiful hammer today. If it opens above 1.08 & stays above that throughout the day, then we have confirmation & price reversal to stop the downtrend. After that we have to follow the charts.


4) Versatile
A spinning top (ST) has formed at the bottom of yesterday's long black candle. This shows that the bulls & bears are in a struggle. It can presage a change in trend. If tomorrow there is a white candle & prices move up, then this ST can be considered a morning star, a bullish pattern & we can say the correction is over for Versatile & prices should move back up. Tomorrow's price movement is all important in calling the change in trend.


5) RHB
This is also displaying a thrusting pattern though its stronger than Tebrau. Its almost a piercing pattern. Its bullish & should end the downtrend.


6) MTD Infra
It closed above the support of 1.08 but is not displaying any further bullishness. Tough to say that the correction is over, we have to wait for further confirmation.

KL Futures, CI & CI Head & Shoulders

Futures
For those trading CI Futures & for a bearing on the CI itself its interesting to study the movement of KLCF. Today's low of 876 has fallen to the strong support level of 870-876. This level has shown strong support for the last 2 years (see circles on chart) & the Index should again bounce back from here. This will also lend support to the CI. Futures traders may want to go long from here, with a cut loss below 870.


CI
The CI itself found support at the 900 level today & as shown in the Chart below, the 900-906 level has provided strong support over the last 2 years. The downside risk is 883, the previous double bottom support. If the CI breaches 900 & falls to 883, that level will be a very strong support for the market to restart its bull run. However, 900 may hold up the market. I would start nibbling quality stocks from this point on & buy strongly if it falls to 885 or so.


Inverted Head & Shoulders?
The last point is whether we will be seeing an Inverted Head & Shoulders formation soon. Certainly there is a possibility of that formation now that it has fallen to 900. From the chart below we can see that today's fall can give us S2 the second 'shoulder' of the IHS. If prices rise to 925 & breakout from that point on high volume (X), we have a neckline (A-B) breakout & prices can rise to 976 (C) which will take it to a strong resistance & complete the IHS move. This is very interesting & we will probably see confirmation soon so keep an eye out for it. Plenty of money to be made if this comes true.

Sunday, July 16, 2006

Be A Contrarian - Buy When Nobody Wants To Buy

The greatest profits are made using this contrarian strategy:

Buy When Nobody Wants To Buy & Sell When Everybody Wants to Buy

Buy when nobody wants to buy.

This does not mean buying when everybody is selling. It means when a market has fallen and all the selling has subsided and there are no real sellers and buyers, then you buy.

Sell when everybody wants to buy

This is simple. When the stock is churning and volume is heavy with a lot of buyers & sellers and the stock is reaching a peak, this is when you sell.

Lets use an example we are familiar with MTD Infra. The chart shows the previous BUY & SELL periods. Will history repeat itself? If it does, then the BUY period is shown & if volume does dry up and there are no buyers, thats where the Contrarian buys. Your chances of making extraordinary profits come from such buying not from buying at or close to peaks.


Dare you be a Contrarian? We'll try an experiment shortly and buy some of these stocks and watch what happens.

Note: Also read this post on further clarification on this strategy:
http://talkingstock.blogspot.com/2006/07/buy-when-nobody-wants-to-buy-refresher.html

The Doc's Stock Trading Rules

In light of the recent fall in the market, I thought it would be useful if we set some Trading Rules which will help traders make and not lose money. If you have comments or other rules that you think we should add to this then please add your comments & I will add them to the rules.

The Doc's Stock Trading Rules

1. Trade only with what you can afford to lose. Do not trade beyond your means

2. Be cautious in your trade. Do not be a day trader if you are a newbie to trading. Day trading is complex and more people lose money on day trading than on buy and hold trades. Leave the day trading to experts. For newbies, day trading benefits only your Remiser/Broker.

3. Holding for the long-term is not a wise move for stock trading. Long-term investments are only for risk averse investors who are more interested in dividends and long-term stock growth. Trading is best done in shorter periods to take advantage of price fluctuations. Even if you buy at 20% above a low and sell at 20% below a high, you will do better than a long-term investor who holds a stock for 5 years or more. Long-term is for Investors not Traders. Decide who you are, an Investor or Trader, then act accordingly.

4. Set Stop Loss targets - Always set a Stop Loss price for every trade. This is very important and will always minimise your losses. This can be in the form of a percentage below the market price or based on TA, but always set a stop loss. Learn more here
http://www.investopedia.com/articles/02/050802.asp

5. Take Profits – As prices rise, take profit. Many people lose money because they never take profit on winning trades and often winning trades become losing trades. You can run with prices but selling small amounts of stocks to take profits is always a good idea.

6. Run With Price Rises – If the stock price rises, run with it, BUT always set trailing stop loss prices. That way as long as prices rise you continue to benefit but if it turns against you, you will still make money. Learn more about trailing stop loss here:
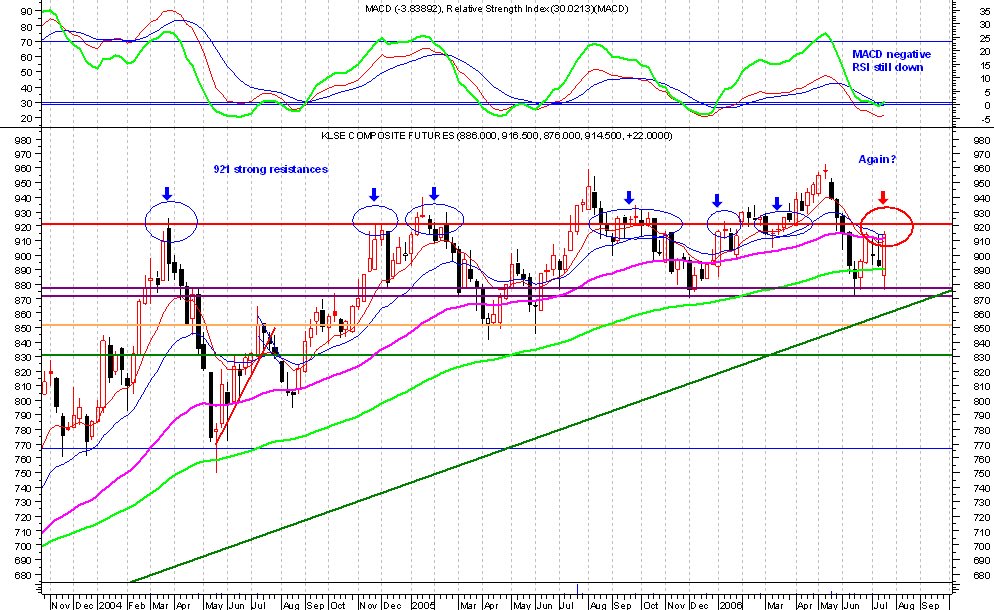
http://www.investopedia.com/articles/trading/03/080603.asp

7. Follow the trend. In any market there will be industry trends and individual stock trends. Don’t go against the trend. In TA you can draw trend lines and if the stock follows a trend assume that will be the future direction until there is a firm indication that a change in trend has occurred. If global markets are falling then assume your market will also follow that trend, similarly if markets are rising you can be safe in assuming that your market will rise as well. It may be a laggard or a leader but it will generally follow the trend. Unless there is a specific factor affecting your market otherwise follow the trend.

8. Have a trading system and use it. Change it only if it is flawed or if it has failed you when you have used it in the proper way. No system is fail proof but having a system is better than no system at all. Technical Analysis or Fundamental Analysis or a combination of both can be used to set up a trading system.

9. Don’t let emotions rule. Whether it is buying or selling use rational analysis not emotions to make a trade.

10. Share knowledge and ask for advice. No matter how much you know about trading and whether it is TA or fundamental analysis, sharing your knowledge and learning from others will only make you a better trader. BUT make sure you only listen to rational advice and not rumours.

Copyright © 2006 Talking Stock with the Doc