DocTS - A New Trading Strategy Using TA
As promised here is the new trading strategy using several different indicators/signals to predict stock price moves. It is a pure Technical Analysis strategy. I call it 'DocTS' (pronounced 'Doctors') - i.e. Doc's Trading Strategy. I would also like to give credit to Isaac who also uses many of these signals & shared them with us. This is a lower risk strategy with a strong success rate & is ideal for use by traders or investors who don't have much appetite for high risk.
The indicators we will use are DMI & ADX, MACDH (Histogram), Simple Moving Averages (7,14 & 30 day), Bolinger Band, Support & Resistance & finally Candlesticks. I explain briefly how the indicators are used but if you are not familiar with them then please read up more from the links I have provided & also use other sources. It will not be possible to discuss the merits of each indicator.
To demonstrate the use of DocTS I have selected Salcon, Utama & Tebrau. Salcon was a strong gainer over the last month, Utama is starting its strong trend now & Tebrau has been trending down. For you to truly benefit from DocTS you have to select & chart stocks yourself. I am happy to discuss your selections but I will not be able to provide anyone with tips if they don't do it themselves. So please don't ask "Doc, RHB how ah, can buy ah?". But if you say "Doc, RHB is meeting all the requirements, but its close to resistance what do you think?" then yes I will be glad to comment. God only helps those who help themselves & so will I .... 8))
The signals & rules are as follows:
1) DMI (Directional Movement Index) & ADX (Average Directional Index)
In DMI we have +ve & -ve DMI. When the +ve DMI crosses -ve DMI, then a positive trend is starting. To choose a stock that is making a positive move, this is the first signal we shall use (you can use others but I prefer this to point to a starting trend). [Click here for info on DMI - http://www.investopedia.com/articles/technical/02/050602.asp]
The ADX is used to gauge the strength of the prevailing trend. ADX is measured on a scale between 0 and 100. Readings below 20 are used to indicate a weak trend, while readings over 40 indicate a strong trend. ADX is not used to determine the direction of a particular trend, but only to gauge its strength. If the +ve DMI is above the -ve DMI & the ADX is above 40 then we have a strong uptrend. But if the -ve DMI is above the +ve DMI & ADX is above 40 then the downtrend is stronger.
http://www.investopedia.com/terms/a/adx.asp
Selling is indicated when -ve DMI crosses +ve DMI, that is when the trend changes & we have then to look at getting out of the stock.
2) MACD Histogram (H) is the 2nd tool. When the H turns upwards (even when it is below zero) it shows that the trend is turning positive & when it crosses the zero line it is a strong positive uptrend. When there are divergences between price & H then trend change is possible. The H is an early indicator of a trend change. Click for more on H - http://www.incrediblecharts.com/technical/macd_histogram.htm
Confirmation 1 - So when we see a +ve DMI crossover & also confirmed by H turning +ve, we have 2 early signs that the stock price is starting a positive move. This puts the stock on the watchlist immediately. But when H reverses itself & starts moving downwards after reaching a high, then a reversal could be beginning. Coupled with -ve DMI crossover, a Sell may be indicated.
3) The Moving Averages are the 3rd tool. Here I use simple MAV not exponential. Both can be used but I use simple MAV because the Bollinger Bands use the simple so to be consistent with BB I also use simple MAV. I use the 7, 14 & 30 day MAV. The BB middle line is a 20-day MAV so this basically gives us 4 MAV to use.
The first sign is look for prices to rise above the 7 & 14 day MAV. These are the early signals. When prices rise above 7 & 14 day MAV it shows a rising price trend. Next the MAV itself must make +ve crossovers, i.e. 7 day (7D) MAV must crossover the 14 day (14D) & ideally both 7D & 14D must crossover the 30D. They must also crossover the middle BB line (i.e. the 20D MAV).
When the shorter term MAV are above the longer term MAV then we have a solid trend in place. So 7D above 14D, 20D & 30D; and 14D over 20D & 30D; and finally 20D above 30D; then we have strong rising trend. See Salcon chart for this example point X marks the spot where this happens. Click to read more on MAV http://www.incrediblecharts.com/technical/moving_averages_three.htm
When prices are above all these 4 MAV we have a strong uptrend in the stock as shown in Salcon chart point X.
Confirmation 2 - when prices rise above MAV & short term MAV are above long term MAV & this compares to early signs in DMI/ADX and MACDH, then we have a consistent confirmation that a good trend is in place. When all are in positive territory a BUY is definitely indicated.
In reverse, when prices fall below the MAV starting with 7D a reversal may be in progress. But 7D is not strong indication. If prices fall below both 7D & 14D then we must be very careful as a reversal is a strong possibility. If it falls below the 20D (i.e. Mid BB line) then a reversal is definitely confirmed.
Also when the MAV themselves cross below each other a reversal is indicated. So when 7D cross below 14D or both cross below 20D then a reversal will already be in progress and a Sell is indicated.
4) Bollinger Band is a very powerful tool. While it is difficult to master all the nitty gritty of BB, it can be used in a simpler way when coupled with other signals. Here we will look for 3 moves in the BB.
- 1st the BB should ideally be either flat or starting to move upwards (widening with prices moving upwards & upper line moving upwards). A BB that is pointing downwards is still negative & needs to be observed.
- 2nd prices must move upwards within the BB. They can be moving up off the bottom channel line but price must not be going down (this is unlikely to happen if DMI & H are positive).
- 3rd prices must be moving up into the upper channel line or must already be within the upper BB channel (i.e. above the mid-BB line). If price is within the upper channel then it is a strong positive sign esp when BB is widening.
The ideal scenario is:
a) Prices that are in the upper channel or moving into the upper channel.
b) BB is moving up or starting to widen with prices moving up
c) A breakout from a narrow BB with prices moving up is a powerful sign of strong upside breakout. Read more on BB -
http://www.bollingerbands.com/services/bb/
Confirmation 3 - When prices are positive re BB, coupled with DMI/ADX, H & MAV, we have 4 powerful tools to confirm a strong bullish sign and a strong BUY. But when prices cross below midBB line into the lower channel & BB also starts trending down, a Sell is indicated. When this is confirmed with -ve DMI crossover or -ve MAV crossovers then a Sell is a definite possibility.
5) Support & Resistances
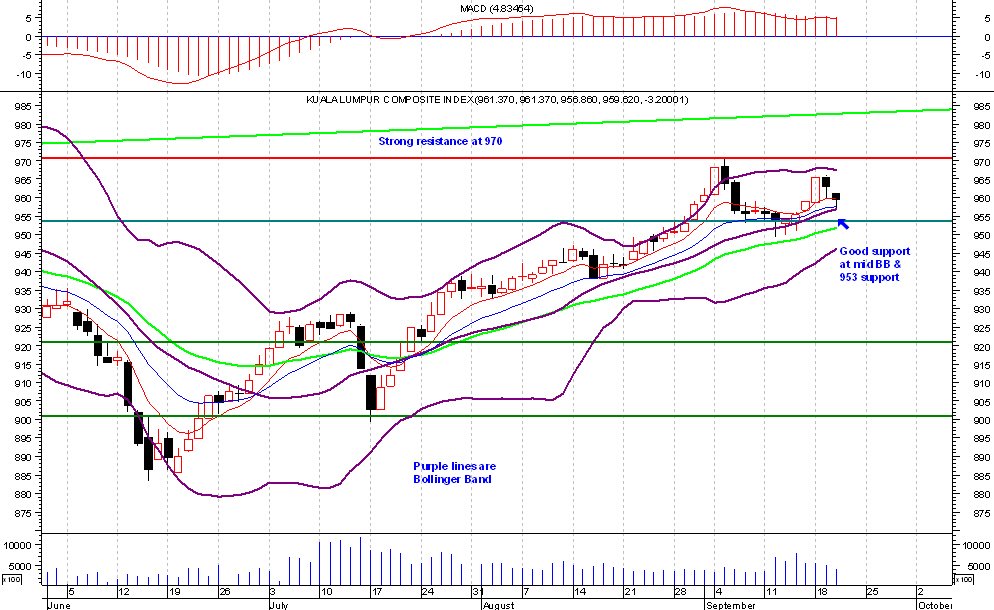
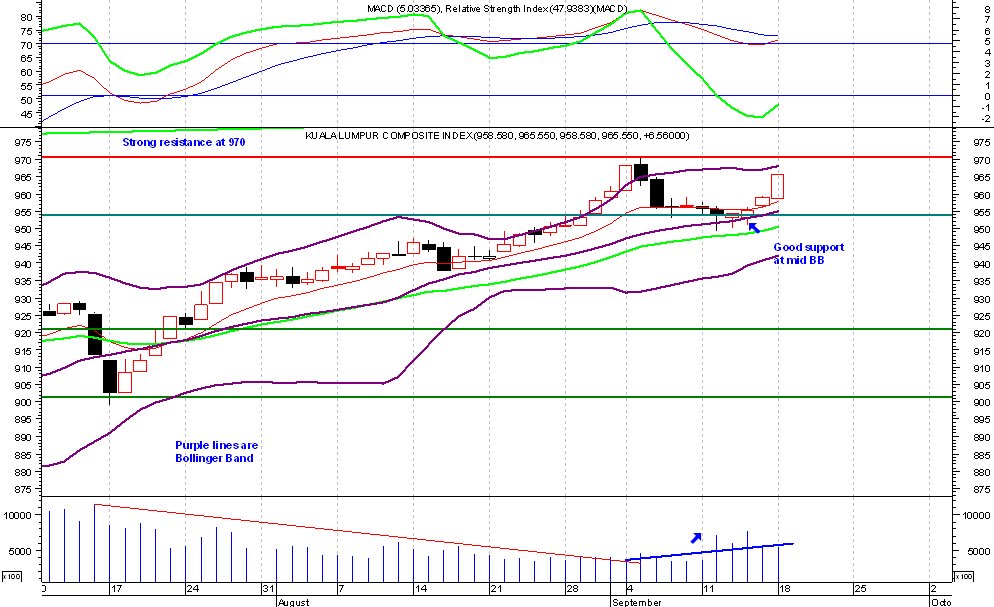
In all cases S&R are very important. When prices are rising & hit a strong resistance we can expect it to either slow down the rise or stop it. But if it breaks out of the resistance then a continuation is likely. We will always continue to monitor S&R, but mostly R in uptrends.
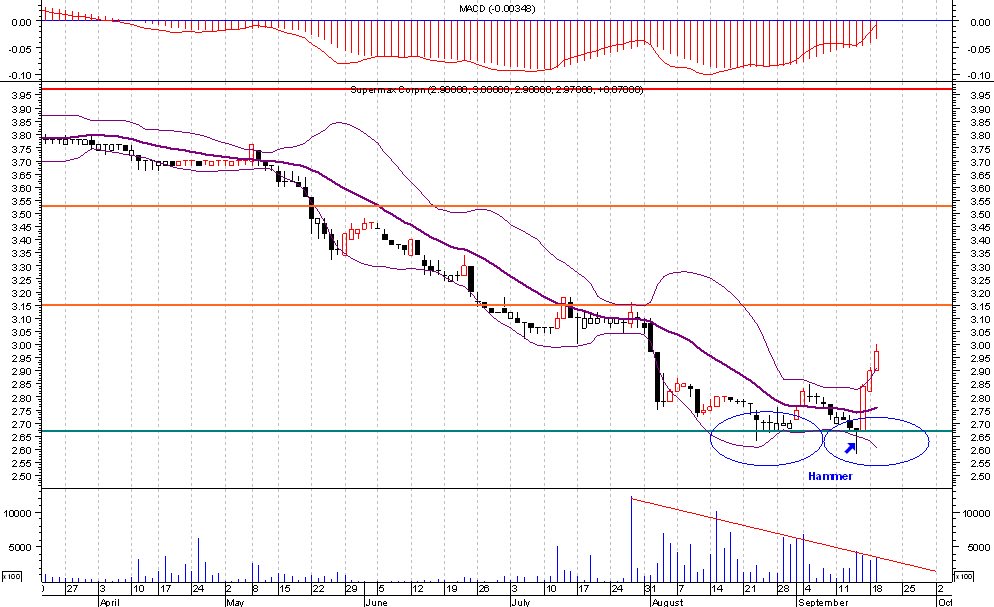
6) Candlesticks - While we can see the buy signals using above indicators it is still necessary to spot early signs of price exhaustion & impending reversals. Candles are very good to show top reversals. Look for bearish engulfing, harami, shooting star or evening stars both in daily & weekly charts. The earlier signals are trend indicators, change in trends using DMI/ADX, H, MAV & BB may be slower but coupled with candles we should be able to spot reversals quite well.
Summary of DocTS
So here we have it, 4 strong trend indicators & 2 reversal indicators. With these 6 signals we should be able to spot good BUYs and SELLs. Some examples are given below.
posted by Dr. Siva @ 1:39 am
5 comments
![]()
![]()


